Mechanisms of transport and exocytosis of dense-core granules containing tissue plasminogen activator in developing hippocampal neurons - PubMed (original) (raw)
Comparative Study
Mechanisms of transport and exocytosis of dense-core granules containing tissue plasminogen activator in developing hippocampal neurons
Michael A Silverman et al. J Neurosci. 2005.
Abstract
Dense-core granules (DCGs) are organelles found in specialized secretory cells, including neuroendocrine cells and neurons. Neuronal DCGs facilitate many critical processes, including the transport and secretion of proteins involved in learning, and yet their transport and exocytosis are poorly understood. We have used wide-field and total internal reflection fluorescence microscopy, in conjunction with transport theory, to visualize the transport and exocytosis of DCGs containing a tissue plasminogen activator-green fluorescent protein hybrid in cell bodies, neurites, and growth cones of developing hippocampal neurons and to quantify the roles that diffusion, directed motion, and immobility play in these processes. Our results demonstrate that shorter-ranged transport of DCGs near sites of exocytosis in hippocampal neurons and neuroendocrine cells differs markedly. Specifically, the immobile fraction of DCGs within growth cones and near the plasma membrane of hippocampal neurons is small and relatively unaltered by actin disruption, unlike in neuroendocrine cells. Moreover, transport of DCGs in these domains of hippocampal neurons is unusually heterogeneous, being significantly rapid and directed as well as slow and diffusive. Our results also demonstrate that exocytosis is preceded by substantial movement and heterogeneous transport; this movement may facilitate delivery of DCG cargo in hippocampal neurons, given the relatively low abundance of neuronal DCGs. In addition, the extensive mobility of DCGs in hippocampal neurons argues strongly against the hypothesis that cortical actin is a major barrier to membrane-proximal DCGs in these cells. Instead, our results suggest that extended release of DCG cargo from hippocampal neurons arises from heterogeneity in DCG mobility.
Figures
Figure 1.
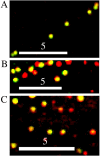
Deblurred images of part of a process of a fixed hippocampal neuron expressing tPA-ECFP (red) and pNPY-EYFP (green) (A), part of a process of a fixed hippocampal neuron expressing tPA-EGFP (green) and immunostained for endogenous SgII (red) (B), and part of the soma of a living hippocampal neuron expressing tPA-EGFP (green) and stained with Lyso-Tracker Red (red) (C) are shown. Areas of overlap appear yellow. We analyzed the immunostained images and assumed that all green, yellow, and red spots are DCGs; this indicates that ∼34-73% of DCGs contain tPA-EGFP. Scale bars, 5 μm.
Figure 2.
Phase (A) and wide-field fluorescence (B, C) images of a growth cone before (B) and 7 min after (C) stimulation with high KCl are shown. D, Temporal dependence of the fluorescence signal from the growth cone before and after stimulation, which occurs at the time point indicated by the arrow. Circles show raw data, and squares show data corrected for photobleaching. Scale bar, 5 μm.
Figure 3.
A, Deblurred fluorescence image of a growth cone and process of a neuron expressing tPA-EGFP (green) that was stained with anti-tubulin antibodies (blue) and Texas Red phalloidin (red). The arrowheads show DCGs that colocalize with microtubules, whereas the arrows show DCGs that colocalize with actin filaments. B, Deblurred fluorescence image of the soma of an untransfected neuron that was stained with anti-tubulin antibodies (blue) and FITC phalloidin (green). C, Deblurred fluorescence image of processes of a hippocampal neuron stained with Texas Red phalloidin showing that actin filaments are significantly disrupted by incubation with 10 μ
m
cytochalasin D for ∼1 h. The inset shows stained, undisrupted actin filaments in part of a process on the same display scale. D, Deblurred fluorescence image of part of the soma and proximal processes of a hippocampal neuron stained with anti-tubulin antibodies showing that microtubules are significantly disrupted by incubation with 30 μ
m
nocodazole for ∼1 h. The inset shows stained, undisrupted microtubules in the soma and proximal processes on the same display scale. Scale bars: A, C, 5 μm; B, D, 10 μm; C (inset), 5 μm; D (inset), 10 μm.
Figure 4.
Phase (A) and deblurred fluorescence (B-D) images showing that the distribution of DCGs containing tPA-EGFP in growth cones changes appreciably over the time scale of 10-27 s. In these images, green denotes DCG positions at a fixed initial time, red denotes DCG positions at the specified later time, and yellow denotes overlap of green and red (immobility). After 3 s, many DCGs still are yellow, indicating that they have not moved or that they occupy a position previously occupied by another DCG. In contrast, after 10 s most DCGs are not yellow, and after 27 s only a few DCGs are yellow. In these images, lack of DCG overlap arises from DCG motion and not from overall motion of the cell. This is clear from (1) the movies, (2) the fact that the overall outline of the cell did not shift, (3) the fact that DCG movement was not correlated, and (4) the fact that a few DCGs basically did not move. Similarly, lack of DCG overlap is not attributable to drift of the imaging apparatus. In both our wide-field and TIRFM movies, center-of-mass positions of a few immobile DCGs shifted significantly <0.1 μm during movie collection (∼45 s). This suggests that the lateral drift rate in movies is <0.1 μm/45 s. Drift in z was similarly negligible. Scale bar, 10 μm.
Figure 5.
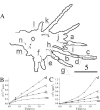
A, Trajectories of DCGs in the growth cone in Figure 4, superimposed on an outline of the growth cone. The starting DCG positions are labeled with a filled circle. Not all of the trajectories shown were generated simultaneously, and a few trajectories corresponding to different times were displaced slightly to avoid overlap. Scale bar, 5 μm. Representative plots of 〈_r_2〉1/2 versus t (B) and 〈_r_2〉 versus t (C) deduced from the DCG trajectories in A are shown. The letters next to the plots identify the trajectories from which the plots were derived. Some values were rescaled so that all plots could be displayed together conveniently. In B, values of 〈_r_2〉1/2 were multiplied by 2 for DCG h. In C, values of 〈_r_2〉 were multiplied by 5 and 2 for DCGs h and m, respectively.
Figure 6.
Comparison wide-field (A) and TIRFM (B) images of the soma and proximal processes of a hippocampal neuron expressing tPA-EGFP are shown. Fluorescence from deeper in the cell (e.g., from the _trans_-Golgi network) is visible only in the wide-field image. C, D, TIRFM images, analogous to those in Figure 4, showing that the distribution of membrane-proximal DCGs containing tPA-EGFP changes appreciably over the time scale of 27 s. Scale bar, 10 μm.
Figure 7.
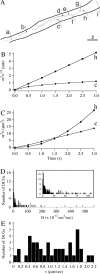
A, Trajectories of membrane-proximal DCGs in a process, superimposed on an outline of the process. The starting DCG positions are labeled with a filled circle. Not all of the trajectories shown were generated simultaneously. Scale bar, 2 μm. B, C, Representative plots, analogous to those in Figure 5, deduced from the DCG trajectories in A. Values of 〈_r_2〉1/2 and 〈_r_2〉 were multiplied by 10 and 1000 for DCG c. D, E, Histograms showing the distribution of diffusion coefficients and speeds obtained in TIRFM experiments. The inset in the diffusion histogram shows just the range covered by the PC12 cell diffusion histogram to facilitate comparison of these histograms over their domain of overlap (Ng et al., 2003).
Figure 8.
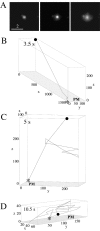
A, Exocytosis event in a process observed using TIRFM. As expected, the punctum at first brightens without spreading and then spreads in the images (left to right) as the DCG approaches the membrane and fuses. Scale bar, 2 μm. Three-dimensional trajectories of fusing DCGs showing the existence of prefusion movement that is substantially lateral (B), axial (C), and random (D) are shown. The numbers along the axes indicate distance in nanometers; the numbers in the top left corners indicate elapsed time. The starting DCG positions are labeled with a filled circle, exocytosis points are labeled with an asterisk, and the plasma membrane is labeled with the letters PM. We attributed brightening that occurs just before the apparent onset of fusion to axial movement and not to increases in DCG pH associated with the opening of a fusion pore, if the DCG was very dim before brightening and also moved laterally.
Similar articles
- Efficient copackaging and cotransport yields postsynaptic colocalization of neuromodulators associated with synaptic plasticity.
Lochner JE, Spangler E, Chavarha M, Jacobs C, McAllister K, Schuttner LC, Scalettar BA. Lochner JE, et al. Dev Neurobiol. 2008 Sep 1;68(10):1243-56. doi: 10.1002/dneu.20650. Dev Neurobiol. 2008. PMID: 18563704 Free PMC article. - Hindered submicron mobility and long-term storage of presynaptic dense-core granules revealed by single-particle tracking.
Scalettar BA, Jacobs C, Fulwiler A, Prahl L, Simon A, Hilken L, Lochner JE. Scalettar BA, et al. Dev Neurobiol. 2012 Sep;72(9):1181-95. doi: 10.1002/dneu.20984. Epub 2012 Jun 21. Dev Neurobiol. 2012. PMID: 21976424 Free PMC article. - Activity-dependent release of tissue plasminogen activator from the dendritic spines of hippocampal neurons revealed by live-cell imaging.
Lochner JE, Honigman LS, Grant WF, Gessford SK, Hansen AB, Silverman MA, Scalettar BA. Lochner JE, et al. J Neurobiol. 2006 May;66(6):564-77. doi: 10.1002/neu.20250. J Neurobiol. 2006. PMID: 16555239 - How neurosecretory vesicles release their cargo.
Scalettar BA. Scalettar BA. Neuroscientist. 2006 Apr;12(2):164-76. doi: 10.1177/1073858405284258. Neuroscientist. 2006. PMID: 16514013 Review. - Multiple roles for the actin cytoskeleton during regulated exocytosis.
Porat-Shliom N, Milberg O, Masedunskas A, Weigert R. Porat-Shliom N, et al. Cell Mol Life Sci. 2013 Jun;70(12):2099-121. doi: 10.1007/s00018-012-1156-5. Epub 2012 Sep 18. Cell Mol Life Sci. 2013. PMID: 22986507 Free PMC article. Review.
Cited by
- Expression of the dominant-negative tail of myosin Va enhances exocytosis of large dense core vesicles in neurons.
Bittins CM, Eichler TW, Gerdes HH. Bittins CM, et al. Cell Mol Neurobiol. 2009 Jun;29(4):597-608. doi: 10.1007/s10571-009-9352-z. Epub 2009 Feb 13. Cell Mol Neurobiol. 2009. PMID: 19214741 Free PMC article. - Munc13 controls the location and efficiency of dense-core vesicle release in neurons.
van de Bospoort R, Farina M, Schmitz SK, de Jong A, de Wit H, Verhage M, Toonen RF. van de Bospoort R, et al. J Cell Biol. 2012 Dec 10;199(6):883-91. doi: 10.1083/jcb.201208024. J Cell Biol. 2012. PMID: 23229896 Free PMC article. - Motion matters: secretory granule motion adjacent to the plasma membrane and exocytosis.
Allersma MW, Bittner MA, Axelrod D, Holz RW. Allersma MW, et al. Mol Biol Cell. 2006 May;17(5):2424-38. doi: 10.1091/mbc.e05-10-0938. Epub 2006 Mar 1. Mol Biol Cell. 2006. PMID: 16510523 Free PMC article. - Efficient copackaging and cotransport yields postsynaptic colocalization of neuromodulators associated with synaptic plasticity.
Lochner JE, Spangler E, Chavarha M, Jacobs C, McAllister K, Schuttner LC, Scalettar BA. Lochner JE, et al. Dev Neurobiol. 2008 Sep 1;68(10):1243-56. doi: 10.1002/dneu.20650. Dev Neurobiol. 2008. PMID: 18563704 Free PMC article. - Stochastic Subcellular Organization of Dense-Core Vesicles Revealed by Point Pattern Analysis.
Robinson BJ, Stanisavljevic B, Silverman MA, Scalettar BA. Robinson BJ, et al. Biophys J. 2016 Aug 23;111(4):852-863. doi: 10.1016/j.bpj.2016.07.019. Biophys J. 2016. PMID: 27558728 Free PMC article.
References
- Alberts B, Johnson A, Lewis J, Raff M, Roberts K, Walter P (2002) Molecular biology of the cell. New York: Garland Science.
- Axelrod D (2003) Total internal reflection fluorescence microscopy in cell biology. Methods Enzymol 361: 1-33. - PubMed
Publication types
MeSH terms
Substances
Grants and funding
- 1-R15-GM61539-01/GM/NIGMS NIH HHS/United States
- 1-R15-NS048047-01/NS/NINDS NIH HHS/United States
- 1-R15-NS40425-01/NS/NINDS NIH HHS/United States
- MH66179/MH/NIMH NIH HHS/United States
LinkOut - more resources
Full Text Sources


