Role of curvature and phase transition in lipid sorting and fission of membrane tubules - PubMed (original) (raw)
Role of curvature and phase transition in lipid sorting and fission of membrane tubules
Aurélien Roux et al. EMBO J. 2005.
Abstract
We have recently developed a minimal system for generating long tubular nanostructures that resemble tubes observed in vivo with biological membranes. Here, we studied membrane tube pulling in ternary mixtures of sphingomyelin, phosphatidylcholine and cholesterol. Two salient results emerged: the lipid composition is significantly different in the tubes and in the vesicles; tube fission is observed when phase separation is generated in the tubes. This shows that lipid sorting may depend critically on both membrane curvature and phase separation. Phase separation also appears to be important for membrane fission in tubes pulled out of giant liposomes or purified Golgi membranes.
Figures
Figure 1
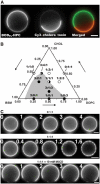
Phase separation in GUVs. (A) Segregation of BODIPYFL-C5-HPC and GM1-ganglioside in a 3:1:3 GUV. GM1 was labeled by addition of 3 μg/ml of Cy3-cholera toxin in the buffer. Left image: BODIPYFL-C5-HPC partially segregates between the two domains; middle image: GM1 is only present in the Lo domain; right: note the perfect complementarity of the domains. Bar, 10 μm. (B) Schematic phase diagram deduced from data obtained with 11 different compositions of lipid mixture at room temperature (22°C). The gray area represents the predicted region where vesicles show domains without photoactivation or treatment with MβCD. The white area corresponds to homogeneous vesicles. Filled circles: compositions showing phase separation; open circles: compositions that are homogeneous and not sensitive to photoactivation; half-white, half-filled circles: compositions at the frontier between segregated and nonsegregated states. (C) Induction of phase separation of lipids by strong photoactivation. Vesicles made of only DOPC and Chol (0:1:1) do not exhibit formation of domains under photoactivation. In contrast, photoactivation of GUVs made of BSM, Chol and DOPC (1:1:1) induces the apparition of small domains that rapidly fuse together. Photoactivation had no effect when lipids were segregated by incubation of GUVs in the presence of 10 mM MβCD. Time is in seconds. Bars, 10 μm.
Figure 2
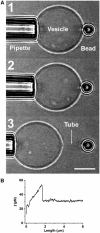
Measurement of GUV bending rigidity using a micropipette and optical tweezers. (A) (1) A GUV aspirated into a micropipette has a fixed tension. (2) The GUV containing biotinylated lipids is pressed against a 3.5 μm diameter streptavidin bead trapped by the optical tweezers. (3) The GUV is retracted and a thin tube can be formed. Bar, 10 μm. (B) A typical force–tube extension curve obtained for a 1:1:0 vesicle at a fixed tension (σ=1.3 × 10⁻⁵ N/m) during the tube extraction.
Figure 3
Lipid sorting in tubes pulled out of ‘segregated' vesicles. (A) Linear variation of the force f required to extend a tube from a vesicle in the L0 phase (1:1:0) (squares) and in the Ld phase (0:1:1) (circles) as a function of the square root of the membrane tension  The experiments were performed on seven (squares) and 11 (circles) vesicles, as described in the text. Line slopes are proportional to the square root of the bending rigidities
  (B) Segregation of fluorescent and biotinylated lipids in a vesicle (3:1:3 mixture): BODIPYFL-C5-HPC (BODFL-HPC) is segregating in the Ld phase; note in the middle image that the biotinylated Cap-DOPE labeled with Cy3-streptavidin (Cy3 Strp) is not segregated. Bar, 10 μm. (C) Percentage of tubes connected to the Ld phase labeled with BODIPYFL-C5-HPC versus lipid composition: 1:1:1 seg is the segregated subpopulation of 1:1:1 GUVs (see Supplementary Figure S1A). For each lipid composition, between 60 and 120 tubes were examined. (D) Tubes pulled out of a ‘segregated' vesicle (3:1:3 mixture) labeled with both BODIPYFL-C5-HPC (BODFL-HPC) (green) and fluorescent cholera toxin-GM1 complex (red). Tubes appear green and connected to the green domain (arrows). They are thus in the Ld phase. White fluorescent spots are bead aggregates, which do not interfere with the experiment. Bar, 10 μm.
Figure 4
Lipid sorting in tubes pulled out of homogeneous vesicles (1:1:1 mixture). (A) Confocal images of tubes pulled out of membranes labeled with BODIPYFL-C5-HPC lipids (BODFL-HPC) and Cy3-cholera toxin–GM1 complexes (GM1). Images were recorded at two levels: one at the vesicle equator (vesicle image) and one on the substrate (tube image) (for more details, see Supplementary data). Left fluorescence image corresponds to the BODFL-HPC channel, whereas the right image to the GM1 channel. Tube images show that the (BODFL-HPC) intensity is higher than that of Cy3-cholera toxin (GM1), whereas it is the opposite in the vesicle image (see insets). Fluorescence intensities of BODFL-HPC and GM1 respectively in the tubes (_I_Bt, _I_Gt) and in the vesicle (_I_Bv, _I_Gv) were measured from tube and vesicle images (see Materials and methods). Highly fluorescent dots on the vesicle images correspond to the connection between the tubes and the vesicle. Bar, 10 μm. (B) The fluorescence ratio FR=(_I_Bt/_I_Gt)/(_I_Bv/_I_Gv) was calculated for each network. Two compositions were tested: 0:1:1 and 1:1:1. For 0:1:1 (Ld phase), the vesicles contained two Ld phase fluorophores (BODFL-HPC and TRITC-DHPE) as a control experiment; the FR histogram (blue) calculated from 30 different networks was centered on the value 1, indicating that no relative sorting occurs under these conditions. For 1:1:1, vesicles contained 1% GM1 and 0.5% BODFL-HPC; FR histogram (red) shows that values obtained from 30 different networks were always superior to 1, reflecting a relative depletion of GM1 in tubes or equivalently a relative enrichment in BODFL-HPC. (C) Tubes pulled out of homogeneous vesicles (1:1:1 mixture) during phase separation by weak and strong photoactivation. Under weak photoactivation, no phase separation is observable along the tubes even after 75 s of constant illumination, whereas the vesicle has reached a complete segregation (the arrow points to the Lo domain). Under strong photoactivation, very small weakly fluorescent domains appear on tubes (see medium size arrows), leading to fission (big arrows). The vesicle is segregated after 5 s of constant illumination (small arrows point to Lo domains). The enlarged area showing tubes is delimited in the last picture. Note the downscaling of the fluorescence intensities in the tubes compared to those present in the vesicles, due to the small number of fluorescent molecules in a nanometer size tube. Bars, 10 μm.
Figure 5
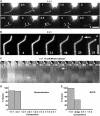
Phase separation induces tube fission. (A) Strong photoactivation of tubes growing from 1:1:1 vesicles leads to tube fission. Fission events (large arrows) occurred predominantly at the sites of formation of weakly fluorescent domains resulting from phase separation (small arrows) (see also movie Figure 4A and movie S1 in Supplementary data). Numbers in the images A, B and C correspond to time in seconds. Bar, 10 μm. (B) Strong photoactivation of a tube grown from a 3:4:1 vesicle led to phase separation, resulting in a thin highly fluorescent (Ld phase) tube at the tip connected to a wider and less fluorescent (Lo phase) tube. A fission event occurs (arrow) after several seconds at the limit between Ld and Lo domains. Bar, 10 μm. (C) The addition of 10 mM MβCD after tube extraction leads to fission of tubes (arrows) growing from 1:1:1 vesicles (see also movie Figure 4C in Supplementary data). Time 0 corresponds to the injection of MβCD. Bars, 10 μm. (D) Percentages of tube networks showing at least one fission event under strong photoactivation as a function of their composition. (E) Percentage of networks grown from vesicles of various compositions and from Golgi membranes showing at least one fission event after injection of MβCD.
Similar articles
- Lipid bilayer discs and banded tubules: photoinduced lipid sorting in ternary mixtures.
Yuan J, Hira SM, Strouse GF, Hirst LS. Yuan J, et al. J Am Chem Soc. 2008 Feb 13;130(6):2067-72. doi: 10.1021/ja710305c. Epub 2008 Jan 23. J Am Chem Soc. 2008. PMID: 18211072 - Phase diagrams of lipid mixtures relevant to the study of membrane rafts.
Goñi FM, Alonso A, Bagatolli LA, Brown RE, Marsh D, Prieto M, Thewalt JL. Goñi FM, et al. Biochim Biophys Acta. 2008 Nov-Dec;1781(11-12):665-84. doi: 10.1016/j.bbalip.2008.09.002. Epub 2008 Oct 7. Biochim Biophys Acta. 2008. PMID: 18952002 Free PMC article. Review. - Temperature and composition dependence of the interaction of delta-lysin with ternary mixtures of sphingomyelin/cholesterol/POPC.
Pokorny A, Yandek LE, Elegbede AI, Hinderliter A, Almeida PF. Pokorny A, et al. Biophys J. 2006 Sep 15;91(6):2184-97. doi: 10.1529/biophysj.106.085027. Epub 2006 Jun 23. Biophys J. 2006. PMID: 16798807 Free PMC article. - Reconstituting ring-rafts in bud-mimicking topography of model membranes.
Ryu YS, Lee IH, Suh JH, Park SC, Oh S, Jordan LR, Wittenberg NJ, Oh SH, Jeon NL, Lee B, Parikh AN, Lee SD. Ryu YS, et al. Nat Commun. 2014 Jul 24;5:4507. doi: 10.1038/ncomms5507. Nat Commun. 2014. PMID: 25058275 Free PMC article. - Targeting membrane proteins to liquid-ordered phases: molecular self-organization explored by fluorescence correlation spectroscopy.
Kahya N. Kahya N. Chem Phys Lipids. 2006 Jun;141(1-2):158-68. doi: 10.1016/j.chemphyslip.2006.02.026. Epub 2006 Apr 4. Chem Phys Lipids. 2006. PMID: 16696961 Review.
Cited by
- To forge a solid immune recognition.
Shi Y. Shi Y. Protein Cell. 2012 Aug;3(8):564-70. doi: 10.1007/s13238-012-2933-5. Protein Cell. 2012. PMID: 22717983 Free PMC article. - Identification of genes affecting vacuole membrane fragmentation in Saccharomyces cerevisiae.
Michaillat L, Mayer A. Michaillat L, et al. PLoS One. 2013;8(2):e54160. doi: 10.1371/journal.pone.0054160. Epub 2013 Feb 1. PLoS One. 2013. PMID: 23383298 Free PMC article. - Coupling between lipid shape and membrane curvature.
Cooke IR, Deserno M. Cooke IR, et al. Biophys J. 2006 Jul 15;91(2):487-95. doi: 10.1529/biophysj.105.078683. Biophys J. 2006. PMID: 16807230 Free PMC article. - ABCA1, from pathology to membrane function.
Zarubica A, Trompier D, Chimini G. Zarubica A, et al. Pflugers Arch. 2007 Feb;453(5):569-79. doi: 10.1007/s00424-006-0108-z. Epub 2006 Jul 21. Pflugers Arch. 2007. PMID: 16858612 Review. - The conical shape of DIM lipids promotes Mycobacterium tuberculosis infection of macrophages.
Augenstreich J, Haanappel E, Ferré G, Czaplicki G, Jolibois F, Destainville N, Guilhot C, Milon A, Astarie-Dequeker C, Chavent M. Augenstreich J, et al. Proc Natl Acad Sci U S A. 2019 Dec 17;116(51):25649-25658. doi: 10.1073/pnas.1910368116. Epub 2019 Nov 22. Proc Natl Acad Sci U S A. 2019. PMID: 31757855 Free PMC article.
References
- Allain J-M, Storm C, Roux A, Ben Amar M, Joanny JF (2004) Fission of a multiphase membrane tube. Phys Rev Lett 93: 158104. - PubMed
- Angelova MI, Soléau S, Méléard P, Faucon JF, Bothorel P (1992) Preparation of giant vesicles by external AC electric fields. Kinetics and applications. Prog Colloid Polym Sci 89: 127–131
- Baumgart T, Hess ST, Webb WW (2003) Imaging coexisting fluid domains in biomembrane models coupling curvature and line tension. Nature 425: 821–824 - PubMed
- Bloom M, Evans E, Mouritsen OG (1991) Physical properties of the fluid lipid-bilayer component of cell membranes: a perspective. Q Rev Biophys 24: 293–397 - PubMed
Publication types
MeSH terms
Substances
LinkOut - more resources
Full Text Sources
Other Literature Sources
Medical


