Three-dimensional EM structure of the ectodomain of integrin {alpha}V{beta}3 in a complex with fibronectin - PubMed (original) (raw)
Three-dimensional EM structure of the ectodomain of integrin {alpha}V{beta}3 in a complex with fibronectin
Brian D Adair et al. J Cell Biol. 2005.
Abstract
Integrins are alphabeta heterodimeric cell surface receptors that mediate transmembrane signaling by binding extracellular and cytoplasmic ligands. The ectodomain of integrin alphaVbeta3 crystallizes in a bent, genuflexed conformation considered to be inactive (unable to bind physiological ligands in solution) unless it is fully extended by activating stimuli. We generated a stable, soluble complex of the Mn(2+)-bound alphaVbeta3 ectodomain with a fragment of fibronectin (FN) containing type III domains 7 to 10 and the EDB domain (FN7-EDB-10). Transmission electron microscopy and single particle image analysis were used to determine the three-dimensional structure of this complex. Most alphaVbeta3 particles, whether unliganded or FN-bound, displayed compact, triangular shapes. A difference map comparing ligand-free and FN-bound alphaVbeta3 revealed density that could accommodate the RGD-containing FN10 in proximity to the ligand-binding site of beta3, with FN9 just adjacent to the synergy site binding region of alphaV. We conclude that the ectodomain of alphaVbeta3 manifests a bent conformation that is capable of stably binding a physiological ligand in solution.
Figures
Figure 1.
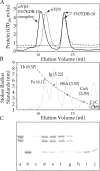
αVβ3 ectodomain forms a soluble 1:1 complex with FN7-EDB-10 in solution. (A) Salt-exchanged αVβ3 ectodomain (dotted curve), FN7-EDB-10 (dashed curve), or a mixture of the two (54 nmol of the integrin and 77 nmol of FN-7-EDB-10; solid curve) were resolved on a Superdex S-200 column in 1 mM Mn2+ buffer. When αVβ3 is mixed with excess FN7-EDB-10, the FN peak is retained, the unliganded αVβ3 is lost, and a new peak of the complex at a peak elution volume of 10.3 ml (Rs ∼7.3 nm) appears. (B) The elution profiles and the calculated Stokes' radii (Rs in nm) of the protein standards (indicated) and the fitted standard curve. The protein standards are Thyroglobin (Th), Ferritin (Fe), IgG (Ig), bovine serum albumin (BSA), carbonic anhydrase (CaA), and cytochrome c (CyC). Unliganded αVβ3 and FN7-EDB-10 elute as single symmetrical peaks at peak elution volumes of 11.3 and 13.8 ml, respectively. (C) Coomassie-stained 8% SDS-PAGE of the aliquots from eluted fractions (0.5 ml) of the stoichiometric mixture, showing the αV and β3 subunits of αVβ3 and FN7-EDB-10. Lane a, purified αVβ3 integrin; lane b, purified FN7-EDB-10. Lanes c–j column fractions: 9.5 ml (c), 10 ml (d), 10.5 ml (e), 11 ml (f), 11.5 ml (g), 13.5 ml (h), 14 ml (i), 14.5 ml (j). Note the approximate 1:1 stoichiometry of the chains in lanes c–g.
Figure 2.
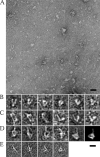
Raw EM images of bent and extended forms. (A) Field of integrin αVβ3/FN7-EDB-10 particles stained with uranyl acetate. The image has been subjected to a low-pass Fourier filter corresponding to the first node of the CTF. Bar, 500 Å. (B) A selection of raw αVβ3/FN7-EDB-10 particles that have a bent shape. For clarity, the particles have been subjected to a Fourier low-pass filter corresponding approximately to the first zero of the CTF. (C) A selection of raw αVβ3/FN7-EDB-10 particles that show a straighter, extended shape. The first three images show a fully extended form, whereas the last three images show an ∼90° bend. The particles have been filtered as in B. (D) Views of αVβ3 in a complex with FN7-EDB-10. The first four images are raw particles with a similar orientation to B, with additional density interpreted as FN7-EDB-10 projecting from the head. The fifth image is an average generated from a limited set of 304 manually selected raw particles specifically judged to be lying on their sides in the bent conformation with FN7-EDB-10 to be projecting from the head. The particles were subjected to reference-free alignment and classification. The average is from the largest of six groups, which contained 94 particles. The final image is a projection of a model of the αVβ3 X-ray structure in a complex with FN7-EDB-10. The image is the best match of the model with the average shown in the fifth image. (E) Averages of negatively stained FN7-EDB-10 from a manually selected data set of 352 particles and subjected to reference-free alignment and classification into 16 groups. The images, from left to right, are generated from 24, 25, 25, and 19 particles, respectively, and demonstrate a linear form on the left and forms with one or several bends between adjacent type III domains on the right (right three images). Bar, 100 Å.
Figure 3.
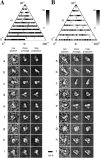
Orientation distribution and projection views of uncomplexed αVβ3 and in a complex with FN. The top panels display histograms of the orientation distribution of raw images in each view of the final 18th round of refinement for free αVβ3 (A) and the 12th round of refinement for the complex between αVβ3 and FN7-EDB-10 (B). Images were aligned translationally (x and y) and rotationally in plane (ω), and each particle was assigned to the group to which it is best correlated (Adair and Yeager, 2002). Each circle represents a projection of the final model at a given (θ) and (ϕ) Euler angle (indicated on the axes). The intensity of each spot (black to white) is linearly proportional to the number of raw particles in that class reflected in the scale bar. The letters indicate spots (classes a–i) from which selected images with averaged views are shown. The left panels contain a raw particle image taken from the class (a–i). The middle panels contain the average calculated from all the particles in that class, and the right panels contain the map projection used to classify the particles. For clarity, the raw particles have been low-pass Fourier-filtered to approximately the first zero of the CTF.
Figure 4.
FSC plot to estimate map resolution. An FSC plot of the final round of refinement for free αVβ3 (solid curve) and in a complex with FN7-EDB-10 (dashed curve). Each data set was divided into two equal groups, the particles in each half data set were independently aligned with projections of the final model, and two independent maps were correlated in Fourier space. The solid and dashed curves cross the 50% threshold at ∼30-Å resolution. The dotted line is the FSC between the final maps for the complex and uncomplexed samples (full data for each map). The two maps deviate from each other even at low resolution, indicating that the two structures are clearly different.
Figure 5.
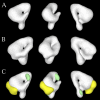
EM integrin structures. A refined surface-shaded density map of unliganded αVβ3 (A) and αVβ in a complex with FN7-EDB-10 (B). The maps were filtered to 30-Å resolution, and the isosurface contour level was set to the same 3.4 σ value for each map. The map in A is from the final (18th) refinement round and was generated using 8,841 particle images. The map in B is from the final (12th) refinement round and was generated using 3,722 particle images. (C) The difference map generated by superimposition of the αVβ3/FN7-EDB-10 complex map (B) on the αVβ3 map (A). The map (C) has been colored to indicate the residual density assigned to FN (yellow) and αVβ3 (green). In each panel, the middle view was generated by a z-axis rotation of the left view by 45 and 180° for the right view. Viewpoints in A–C are similar.
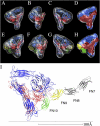
Figure 6.
Pseudoatomic models of unliganded and liganded αVβ3. The red and blue chains are αV and β3, respectively. The FN9 (yellow) and FN10 (green) chains were derived from the X-ray structure of FN7-10 (Leahy et al., 1996) and were positioned such that the RGD loop of FN10 is superimposed on the cyclic RGD peptide in αVβ3 (Xiong et al., 2002). The isosurface levels for the maps have been set to 2.6 σ for each map. (A–C) A ribbon diagram of the αVβ3 crystal structure (Xiong et al., 2001) and the recently determined crystal structure of αVβ3 including the PSI domain (Xiong et al., 2004) fitted within the uncomplexed map. The views in B and C are produced by a rotation of the view in A by 135 and 180°, respectively. (D) The accessible surface of αVβ3 (1.4-Å probe radius) fitted in the map in the same view as C. The molecules in D are colored as in the ribbon models. (E–G) Ribbon diagrams of the αVβ3/FN9-10 complex fitted within the αVβ3/FN7-EDB-10 map in the same orientations as A–C. (H) An accessible surface model within the map viewed in the same orientation as G. (I) A ribbon diagram of a model of the X-ray structure of αVβ3 ectodomain in a complex with FN7-10 (Leahy et al., 1996) in the same orientation as in G. The FN10 RGD loop (positioned to superimpose on the cyclic RGD peptide in αVβ3) and the ligand Asp and Arg side chains are shown. αV and β3 are shown in blue and red, respectively. The ions at MIDAS (cyan), LIMBS (gray), and ADMIDAS (purple), the propeller base, and the αV genu (orange) are shown. The dotted line represents a putative position of the plasma membrane.
Similar articles
- Activation mechanisms of αVβ3 integrin by binding to fibronectin: A computational study.
Wang L, Pan D, Yan Q, Song Y. Wang L, et al. Protein Sci. 2017 Jun;26(6):1124-1137. doi: 10.1002/pro.3163. Epub 2017 Apr 7. Protein Sci. 2017. PMID: 28340512 Free PMC article. - Mapping of heparin/heparan sulfate binding sites on αvβ3 integrin by molecular docking.
Ballut L, Sapay N, Chautard E, Imberty A, Ricard-Blum S. Ballut L, et al. J Mol Recognit. 2013 Feb;26(2):76-85. doi: 10.1002/jmr.2250. J Mol Recognit. 2013. PMID: 23334915 - Structure of integrin alpha5beta1 in complex with fibronectin.
Takagi J, Strokovich K, Springer TA, Walz T. Takagi J, et al. EMBO J. 2003 Sep 15;22(18):4607-15. doi: 10.1093/emboj/cdg445. EMBO J. 2003. PMID: 12970173 Free PMC article. - Structural basis for ligand recognition by RGD (Arg-Gly-Asp)-dependent integrins.
Takagi J. Takagi J. Biochem Soc Trans. 2004 Jun;32(Pt3):403-6. doi: 10.1042/BST0320403. Biochem Soc Trans. 2004. PMID: 15157147 Review. - Coming to grips with integrin binding to ligands.
Arnaout MA, Goodman SL, Xiong JP. Arnaout MA, et al. Curr Opin Cell Biol. 2002 Oct;14(5):641-51. doi: 10.1016/s0955-0674(02)00371-x. Curr Opin Cell Biol. 2002. PMID: 12231361 Review.
Cited by
- The antithrombotic potential of selective blockade of talin-dependent integrin alpha IIb beta 3 (platelet GPIIb-IIIa) activation.
Petrich BG, Fogelstrand P, Partridge AW, Yousefi N, Ablooglu AJ, Shattil SJ, Ginsberg MH. Petrich BG, et al. J Clin Invest. 2007 Aug;117(8):2250-9. doi: 10.1172/JCI31024. J Clin Invest. 2007. PMID: 17627302 Free PMC article. - Structural basis for pure antagonism of integrin αVβ3 by a high-affinity form of fibronectin.
Van Agthoven JF, Xiong JP, Alonso JL, Rui X, Adair BD, Goodman SL, Arnaout MA. Van Agthoven JF, et al. Nat Struct Mol Biol. 2014 Apr;21(4):383-8. doi: 10.1038/nsmb.2797. Epub 2014 Mar 23. Nat Struct Mol Biol. 2014. PMID: 24658351 Free PMC article. - Activation mechanisms of αVβ3 integrin by binding to fibronectin: A computational study.
Wang L, Pan D, Yan Q, Song Y. Wang L, et al. Protein Sci. 2017 Jun;26(6):1124-1137. doi: 10.1002/pro.3163. Epub 2017 Apr 7. Protein Sci. 2017. PMID: 28340512 Free PMC article. - The Effect of Titanium Surface Topography on Adherent Macrophage Integrin and Cytokine Expression.
Pitchai MS, Ipe DS, Hamlet S. Pitchai MS, et al. J Funct Biomater. 2023 Apr 11;14(4):211. doi: 10.3390/jfb14040211. J Funct Biomater. 2023. PMID: 37103301 Free PMC article. - Three-Dimensional Structures of Full-Length, Membrane-Embedded Human α(IIb)β(3) Integrin Complexes.
Xu XP, Kim E, Swift M, Smith JW, Volkmann N, Hanein D. Xu XP, et al. Biophys J. 2016 Feb 23;110(4):798-809. doi: 10.1016/j.bpj.2016.01.016. Biophys J. 2016. PMID: 26910421 Free PMC article.
References
- Arnaout, M.A. 2002. Integrin structure: new twists and turns in dynamic cell adhesion. Immunol. Rev. 186:125–140. - PubMed
- Beglova, N., S.C. Blacklow, J. Takagi, and T.A. Springer. 2002. Cysteine-rich module structure reveals a fulcrum for integrin rearrangement upon activation. Nat. Struct. Biol. 9:282–287. - PubMed
- Butta, N., E.G. Arias-Salgado, C. González-Manchón, M. Ferrer, S. Larrucea, M.S. Ayuso, and R. Parrilla. 2003. Disruption of the beta3 663-687 disulfide bridge confers constitutive activity to beta3 integrins. Blood. 102:2491–2497. - PubMed
- Cai, T.Q., S.K. Law, H.R. Zhao, and S.D. Wright. 1995. Reversible inactivation of purified leukocyte integrin CR3 (CD11b/CD18, alpha m beta 2) by removal of divalent cations from a cryptic site. Cell Adhes. Commun. 3:399–406. - PubMed
Publication types
MeSH terms
Substances
LinkOut - more resources
Full Text Sources
Other Literature Sources
Miscellaneous
