Identification of a functional hypoxia-responsive element that regulates the expression of the egl nine homologue 3 (egln3/phd3) gene - PubMed (original) (raw)
Identification of a functional hypoxia-responsive element that regulates the expression of the egl nine homologue 3 (egln3/phd3) gene
Nuria Pescador et al. Biochem J. 2005.
Abstract
Low oxygen levels induce an adaptive response in cells through the activation of HIFs (hypoxia-inducible factors). These transcription factors are mainly regulated by a group of proline hydroxylases that, in the presence of oxygen, target HIF for degradation. The expression of two such enzymes, EGLN1 [EGL nine homologous protein 1, where EGL stands for egg laying defective (Caenorhabditis elegans gene)] and EGLN3, is induced by hypoxia through a negative feedback loop, and we have demonstrated recently that hypoxic induction of EGLN expression is HIF-dependent. In the present study, we have identified an HRE (hypoxia response element) in the region of the EGLN3 gene using a combination of bioinformatics and biological approaches. Initially, we isolated a number of HRE consensus sequences in a region of 40 kb around the human EGLN3 gene and studied their evolutionary conservation. Subsequently, we examined the functionality of the conserved HRE sequences in reporter and chromatin precipitation assays. One of the HREs, located within a conserved region of the first intron of the EGLN3 gene 12 kb downstream of the transcription initiation site, bound HIF in vivo. Furthermore, this sequence was able to drive reporter gene expression under conditions of hypoxia in an HRE-dependent manner. Indeed, we were able to demonstrate that HIF was necessary and sufficient to induce gene expression from this enhancer sequence.
Figures
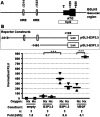
Figure 1. The EGLN3 promoter region is not induced by hypoxia
(A) Diagram of the human EGLN3 promoter region, in which the numbers indicate the nucleotide positions relative to the transcription initiation site. Black boxes represent the first EGLN3 exon comprising residues +1 to +686. The small black box corresponds to the 5′-UTR (from +1 to +329) and the large one to the coding sequence (from +329 to +686). CpG, location of a CpG-rich region according to the UCSD Genome Browser (
). Open boxes indicate the localization of putative HRE core sequences. The regions indicated, −3410 to +169 and −1465 to +169, in the EGLN3 genomic fragment were cloned into pGL3 basic vectors upstream of the firefly luciferase gene to generate pGL3-E3P3.5 and pGL3-E3P1.5 respectively. (B) HeLa cells were transfected with the fragments indicated from EGLN3 or from the VEGF-A promoter cloned into the pGL3 basic reporter plasmid. Upper panel: diagram of the pGL3-E3P3.5 and pGL3-E3P1.5 constructs. Lower panel: after transfection, the cells were cultured under normoxic conditions (Nx) or in an atmosphere of 1% oxygen (Hx) for 24 h before analysing the luciferase activity. The mean results from ‘_n_’ independent experiments, each performed in duplicate (solid bar) are shown. Each type of symbol represents data from an individual experiment. In order to compare between different experiments, the ratio of firefly and Renilla luciferase activities for each sample was normalized to the ratio obtained for the control (empty vector under normoxia). ***, statistically significant differences (P<0.001) between the two indicated samples. The fold induction of hypoxia versus normoxia for each sample is shown.
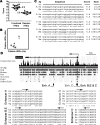
Figure 2. Computer identification of HRE in the EGLN3 locus
(A) The data represent the scores obtained by comparing the sequences from VEGF-A, BNIP3, P4Hα, ROR4α, c-Met, PGK1, Glut-1, promoters (functional HREs; ●) or from random sequences containing a core [A/G]CGT motif (random HREs; ▲), to the position-specific frequency matrix. The horizontal line represents the mean value for each group of data and the number represents its value. The difference between their means was statistically significant (P<0.001, t test). (B) BLAST comparison of the concatenated 124 putative HRE sequences found in the human 40 kb EGLN3 genomic region versus the concatenated 129 sequences found for the mouse locus. (C) Alignment of the five HRE sequences identified in (B) that are conserved between human (Hs) and mouse (Mm). The score for each sequence, according to the position-specific frequency matrix, as well as their rank, is shown. (D) Genomic region of the EGLN3 locus (adapted from UCSD Genome Browser,
). Boxes are open reading frames. The size of the box indicates whether it is UTR or CDS, as indicated in Figure 1. The arrow indicates the direction of transcription. The EGLN3 gene structure, including transcription start site, is based on RefSeq NM_022073. Conservation of sequences among different species is indicated by the black histogram, and the individual homology between different species and human is indicated by grey histograms. The localization of enhancers A–D in the EGLN3 genomic region is indicated by arrows. The sequence conservation of the five putative enhancers between different species is shown; the arrows above the HREs indicate their direction.
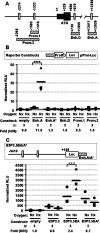
Figure 3. Enhancer A is induced by hypoxia
(A) Diagram of the H. sapiens EGLN3 genomic region in which the numbers indicate nucleotide positions relative to the transcription initiation site, as shown in Figure 1. The indicated regions (hatched boxes) containing putative hypoxia-responsive sequences were cloned into the pProl plasmid upstream of the rat minimal prolactin promoter. (B) HeLa cells were transfected with the fragments from the EGLN3 genomic region indicated, cloned upstream of a minimal promoter (open pointed box). A diagram of the constructs is depicted in the Figure, in which the hatched box represents any of the elements from Figure 3(A). After transfection, the cells were cultured under normoxic (Nx) conditions or in an atmosphere of 1% oxygen (Hx) for 24 h before analysing the luciferase activity. Enh. A* is a reporter construct derived from enhancer A (Enh. A) in which the core ACGT was mutated to TAGC. The data are presented as indicated in Figure 1. (C) The enhancer A sequence, or its mutated form, was cloned into pGL3-E3P3.5 (see Figure 1A) downstream of the firefly luciferase gene as depicted in the Figure (hatched box). HeLa cells were transfected with the indicated constructs and treated as in (B). The data are presented as indicated in Figure 1.
Figure 4. HIF1α binds to enhancer A in vivo
HeLa cells were cultured under normoxic (N) or hypoxia (H) conditions for 12 h and then fixed to cross-link proteins to DNA. Cells were lysed and their DNA fragmented by sonication. Cell lysates were then immunoprecipitated with control IgGs (IgG) or a polyclonal antiserum raised against HIF1α (1α). Co-immunoprecipitated DNA was then amplified by PCR with primers specific for enhancer A (primers 6 and 7, Table 1), enhancer D (primers 8 and 9, Table 1) or collagen proline-4 hydroxylase α promoter (P4Hα; primers 15 and 16, Table 1). Input, sample of fragmented genomic DNA before immunoprecipitation. None, PCR without template. The experiment was repeated three times yielding similar results.
Figure 5. HIFα is necessary and sufficient to induce enhancer A activity
(A) HIF1α-deficient Ka13 cells or HIF1α-competent 4.5 cells were transfected with the constructs indicated (see Figure 3A for details). After transfection, the cells were cultured under normoxic conditions (Nx) or in an atmosphere of 1% oxygen (Hx) for 24 h before analysing the luciferase activity. Results are represented as indicated in Figure 1. (B) HeLa cells were transfected with the indicated constructs derived from enhancer A (see Figure 3A for details) together with a plasmid encoding a stable HIF construct (HIF PP). After transfection, the cells were cultured under normoxic conditions for 48 h before analysing the luciferase activity. Results are represented as indicated in Figure 1.
Similar articles
- Regulation of the prolyl hydroxylase domain protein 2 (phd2/egln-1) gene: identification of a functional hypoxia-responsive element.
Metzen E, Stiehl DP, Doege K, Marxsen JH, Hellwig-Bürgel T, Jelkmann W. Metzen E, et al. Biochem J. 2005 May 1;387(Pt 3):711-7. doi: 10.1042/BJ20041736. Biochem J. 2005. PMID: 15563275 Free PMC article. - Identification of a region on hypoxia-inducible-factor prolyl 4-hydroxylases that determines their specificity for the oxygen degradation domains.
Villar D, Vara-Vega A, Landázuri MO, Del Peso L. Villar D, et al. Biochem J. 2007 Dec 1;408(2):231-40. doi: 10.1042/BJ20071052. Biochem J. 2007. PMID: 17725546 Free PMC article. - Integration of oxygen signaling at the consensus HRE.
Wenger RH, Stiehl DP, Camenisch G. Wenger RH, et al. Sci STKE. 2005 Oct 18;2005(306):re12. doi: 10.1126/stke.3062005re12. Sci STKE. 2005. PMID: 16234508 Review. - Prolyl hydroxylases 2 and 3 act in gliomas as protective negative feedback regulators of hypoxia-inducible factors.
Henze AT, Riedel J, Diem T, Wenner J, Flamme I, Pouyseggur J, Plate KH, Acker T. Henze AT, et al. Cancer Res. 2010 Jan 1;70(1):357-66. doi: 10.1158/0008-5472.CAN-09-1876. Epub 2009 Dec 22. Cancer Res. 2010. PMID: 20028863 - HIF-prolyl hydroxylases and cardiovascular diseases.
Sen Banerjee S, Thirunavukkarasu M, Tipu Rishi M, Sanchez JA, Maulik N, Maulik G. Sen Banerjee S, et al. Toxicol Mech Methods. 2012 Jun;22(5):347-58. doi: 10.3109/15376516.2012.673088. Toxicol Mech Methods. 2012. PMID: 22424133 Review.
Cited by
- Hypoxic induction of the regulator of G-protein signalling 4 gene is mediated by the hypoxia-inducible factor pathway.
Olechnowicz SW, Fedele AO, Peet DJ. Olechnowicz SW, et al. PLoS One. 2012;7(9):e44564. doi: 10.1371/journal.pone.0044564. Epub 2012 Sep 7. PLoS One. 2012. PMID: 22970249 Free PMC article. - Hypoxia induces IGFBP3 in esophageal squamous cancer cells through HIF-1α-mediated mRNA transcription and continuous protein synthesis.
Natsuizaka M, Naganuma S, Kagawa S, Ohashi S, Ahmadi A, Subramanian H, Chang S, Nakagawa KJ, Ji X, Liebhaber SA, Klein-Szanto AJ, Nakagawa H. Natsuizaka M, et al. FASEB J. 2012 Jun;26(6):2620-30. doi: 10.1096/fj.11-198598. Epub 2012 Mar 13. FASEB J. 2012. PMID: 22415309 Free PMC article. - Transcriptional Response to Hypoxia: The Role of HIF-1-Associated Co-Regulators.
Yfantis A, Mylonis I, Chachami G, Nikolaidis M, Amoutzias GD, Paraskeva E, Simos G. Yfantis A, et al. Cells. 2023 Mar 3;12(5):798. doi: 10.3390/cells12050798. Cells. 2023. PMID: 36899934 Free PMC article. Review. - Hypoxia. The role of hypoxia and HIF-dependent signalling events in rheumatoid arthritis.
Muz B, Khan MN, Kiriakidis S, Paleolog EM. Muz B, et al. Arthritis Res Ther. 2009;11(1):201. doi: 10.1186/ar2568. Epub 2009 Jan 20. Arthritis Res Ther. 2009. PMID: 19222864 Free PMC article. Review. - The hypoxia-inducible factor pathway, prolyl hydroxylase domain protein inhibitors, and their roles in bone repair and regeneration.
Fan L, Li J, Yu Z, Dang X, Wang K. Fan L, et al. Biomed Res Int. 2014;2014:239356. doi: 10.1155/2014/239356. Epub 2014 May 11. Biomed Res Int. 2014. PMID: 24895555 Free PMC article. Review.
References
- Wenger R. H. Cellular adaptation to hypoxia: O2-sensing protein hydroxylases, hypoxia-inducible transcription factors, and O2-regulated gene expression. FASEB J. 2002;16:1151–1162. - PubMed
- Ema M., Taya S., Yokotani N., Sogawa K., Matsuda Y., Fujii-Kuriyama Y. A novel bHLH-PAS factor with close sequence similarity to hypoxia-inducible factor 1alpha regulates the VEGF expression and is potentially involved in lung and vascular development. Proc. Natl. Acad. Sci. U.S.A. 1997;94:4273–4278. - PMC - PubMed
- Stroka D. M., Burkhardt T., Desbaillets I., Wenger R. H., Neil D. A., Bauer C., Gassmann M., Candinas D. HIF-1 is expressed in normoxic tissue and displays an organ-specific regulation under systemic hypoxia. FASEB J. 2001;15:2445–2453. - PubMed
Publication types
MeSH terms
Substances
LinkOut - more resources
Full Text Sources
Other Literature Sources
Research Materials


