Highly protective in vivo function of cytomegalovirus IE1 epitope-specific memory CD8 T cells purified by T-cell receptor-based cell sorting - PubMed (original) (raw)
Comparative Study
Highly protective in vivo function of cytomegalovirus IE1 epitope-specific memory CD8 T cells purified by T-cell receptor-based cell sorting
Marcus-Folker Pahl-Seibert et al. J Virol. 2005 May.
Abstract
Reconstitution of antiviral CD8 T cells is essential for controlling cytomegalovirus (CMV) infection after bone marrow transplantation. Accordingly, polyclonal CD8 T cells derived from BALB/c mice infected with murine CMV protect immunocompromised adoptive transfer recipients against CMV disease. The protective population comprises CD8 T cells with T-cell receptors (TCRs) specific for defined and for as-yet-unknown viral epitopes, as well as a majority of nonprotective cells with unrelated specificities. Defined epitopes include IE1/m123 and m164, which are immunodominant in terms of the magnitude of the CD8 T-cell response, and a panel of subordinate epitopes (m04, m18, M45, M83, and M84). While cytolytic T-lymphocyte lines (CTLLs) were shown to be protective regardless of the immunodominance of the respective epitope, the individual contributions of in vivo resident epitope-specific CD8 T cells to the antiviral control awaited investigation. The IE1 peptide 168-YPHFMPTNL-176 is generated from the immediate-early protein 1 (IE1) (pp89/76) of murine CMV and is presented by the major histocompatibility complex class I (MHC-I) molecule Ld. To quantitate its contribution to the protective potential of a CD8-T memory (CD8-TM) cell population, IE1-TCR+ and IE1-TCR- CD8-TM cells were purified by epitope-specific cell sorting with IE1 peptide-loaded MHC-immunoglobulin G1 dimers as ligands of cognate TCRs. Of relevance for clinical approaches to an adoptive cellular immunotherapy, sorted IE1 epitope-specific CD8-TM cells were found to be exceedingly protective upon adoptive transfer. Compared with CTLLs specific for the same epitope and of comparable avidity and TCR beta-chain variable region (Vbeta)-defined polyclonality, sorted CD8-TM cells proved to be superior by more than 2 orders of magnitude.
Figures
FIG. 1.
Representation of TCR Vβ families in CD8 T-cell populations of BALB/c mice. (A) Effect of mCMV infection. The percentage of CD8 T cells expressing a particular Vβ family TCR (Vβx, where x = 2, 4, 6, 7, 8.1 and 8.2, 8.3, 9, 10b, 13, or 14) was determined for unseparated cells from spleens of uninfected mice (from a pool of 4 at 9 weeks of age), from popliteal lymph nodes (pool of 20) on day 8 after intraplantar infection (acute phase), and from spleens (pool of 4) at 10 weeks after intraplantar infection (early memory phase). For two-color cytofluorometric analysis (FITC/FL-1 versus Cy-Chrome/FL-3), Vβ screening panel antibodies were combined with anti-CD8. An electronic gate was set on positive FL-3 to restrict the analysis to CD8 T cells. (B) Representation of TCR Vβ families in IE1 epitope-specific CD8-TM cells. CD8 T cells were isolated by two rounds of positive immunomagnetic cell sorting from spleens (pool of 10) at 28 weeks after intraplantar infection (late memory phase). For two-color cytofluorometric analysis (FITC/FL-1 versus PE/FL-2), Vβ screening panel antibodies were combined with PE-LdTetra-IE1mCMV. The percentage of Vβx+ cells among all CD8 T cells is represented by the percentage of FL-1-positive cells. The percentage of Vβx-positive cells among all IE1 epitope-specific CD8 T cells is represented by the percentage of FL-1-positive cells among FL-2-positive cells.
FIG. 2.
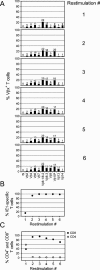
Selection of an IE1 epitope-specific, polyclonal CTLL. Spleen cells from the memory pool characterized in Fig. 1B were used for the generation of an IE1-CTLL. (A) Monitoring of the TCR Vβ composition of the developing line during six rounds of restimulation with synthetic IE1 peptide. For two-color cytofluorometric analysis (FITC/FL-1 versus PE-Cy5/FL-3), Vβ screening panel antibodies were combined with anti-CD3. An electronic gate was set on FL-3-positive cells to restrict the analysis to T cells. (B) Selection for monospecificity.For two-color cytofluorometric analysis (PE/FL-2 versus PE-Cy5/FL-3), PE-LdTetra-IE1mCMV was combined with anti-CD3. An electronic gate was set on FL-3-positive cells to restrict the analysis to T cells. (C) Cells expressing coreceptors CD4 and CD8 in the developing line. For three-color cytofluorometric analysis (Cy-Chrome/FL-3 versus FITC/FL-1 versus PE/FL-2), anti-CD4 and anti-CD8 were combined with an anti-TCR β-chain. An electronic gate was set on FL-2-positive cells to restrict the analysis to T cells.
FIG. 3.
Frequencies of IE1 epitope-specific CD8 T cells. (A) Frequency in an IE1-CTLL. (B) Frequency in a polyspecific population of CD8 T cells derived from spleens of three latently mCMV-infected mice at 4 months after infection. Dimer, labeling of the IE1-TCR with LdDimer-IE1mCMV and PE-conjugated second antibody directed against IgG1. Control staining was performed with LdDimer-NPLCMV. Tetramer, labeling of the IE1-TCR with PE-LdTetra-IE1mCMV. Control staining was performed with PE-LdTetra-NPLCMV. Displayed are dot plots of two-color cytofluorometric analyses with CD8 expression shown by FITC fluorescence (FL-1) intensity on the abscissa and IE1-TCR expression, as well as specificity control shown by PE fluorescence (FL-2) intensity, on the ordinate. Electronic gates were set on living lymphocytes and on positive FL-1 values to restrict the analyses to cells expressing CD8. The percentages of cells double positive for FL-1 and FL-2 are indicated in the upper-right quadrants. Dots represent ∼4,000 IE1-CTL and ∼8,000 CD8 T cells, respectively.
FIG. 4.
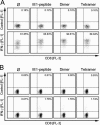
Stimulation of IFN-γ expression by TCR ligation. (A) IE1-CTLL. (B) Polyspecific population of CD8 T cells derived from spleens of three latently mCMV-infected mice at 3 months after infection. CD8 T cells were prepurified by one round of positive immunomagnetic cell sorting and were left without TCR ligation (⊘), pulsed with 10−8 M IE1 peptide (IE1-peptide), incubated with dialyzed LdDimer-IE1mCMV (Dimer), or incubated with PE-LdTetra-IE1mCMV (Tetramer). After cultivation in the presence of brefeldin A, CD8 T cells positive for intracellular IFN-γ were detected by two-color (Cy-Chrome/FL-3 versus FITC/FL-1) cytofluorometric analysis. For verification of IFN-γ labeling specificity, FITC-conjugated rat IgG1 was used as an isotype control. Electronic gates were set on living lymphocytes and on positive FL-3 values to restrict the analyses to CD8 T cells. The percentages of IFN-γ-expressing CD8 T cells are indicated in the upper-right quadrants. Dots represent ∼5,000 IE1-CTL and ∼10,000 CD8 T cells, respectively.
FIG. 5.
Cytolytic in vitro activity of an IE1-CTLL labeled with TCR binding dimers and tetramers. Cells of an IE1-CTLL were either left untouched (left) or labeled with LdDimer-IE1mCMV (center) or LdTetra-IE1mCMV (right). Symbols represent the mean values of triplicate assay cultures. Open circles, lysis of P815 target cells; closed circles, lysis of P815 target cells that were pulsed with synthetic IE1 peptide at a saturating concentration of 10−8 M; E/T, ratio between effector cell number and target cell number.
FIG. 6.
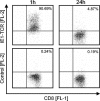
Rapid disappearance of dimer-labeled IE1 epitope-specific TCRs from the cell surface. Cells of an IE1-CTLL were analyzed for expression of CD8 (FL-1, FITC) and IE1-TCR (FL-2, PE) at ∼1 h after the labeling as well as after ∼24 h of incubation at 37°C. IE1-TCRs were detected with LdDimer-IE1mCMV and PE-conjugated second antibody directed against IgG1. See the legend to Fig. 3 for the two-color cytofluorometric analysis and for controls. Dots represent ∼4,000 cells analyzed.
FIG. 7.
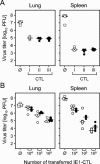
Antiviral in vivo activity of IE1-CTL labeled with TCR binding dimers. (A) Cells of a third-restimulation IE1-CTLL were either left untouched (group I, open circles), labeled with LdDimer-IE1mCMV (group II, closed circles), or incubated for control with the unrelated nonbinding reagent LdDimer-NPLCMV (group III, closed squares). A constant number of 5 × 10⁵ IE1-CTLs were adoptively transferred to BALB/cJ indicator recipients that were immunocompromised by 6 Gy of total-body γ irradiation and were infected subcutaneously with 105 PFU of mCMV. Group ⊘ (open squares), no cell transfer. Virus titers were determined in organ homogenates of lungs and spleen on day 12 after cell transfer. Symbols represent data for individual recipients. The median values are marked. (B) Transfer of the indicated graded cell numbers of another third-restimulation IE1-CTLL (Fig. 2) that were either left untouched (open circles) or labeled with LdDimer-IE1mCMV (closed circles).
FIG. 8.
Antiviral in vivo activity of sort-purified IE1 epitope-specific CD8-TM. Spleen cells were isolated from 5 BALB/cJ mice 3 months after acute mCMV infection. IE1-specific CD8 T cells were purified by cytofluorometric cell sorting (see the legend to Fig. 12 for a detailed sort protocol) using LdDimer-IE1mCMV for epitope-specific TCR labeling. The in vivo-protective antiviral activity was tested by adoptive transfer of 104 sorted cells per immunocompromised recipient (closed circles). On day 12 after cell transfer, virus titers were determined for lungs and spleen (left), and the numbers of infected cells were determined for liver and adrenal (suprarenal) glands (right) in representative 10 mm2- by 2-μm tissue sections (see Fig. 9). Symbols represent data for individual transfer recipients. Median values are marked. Group ⊘ (open squares), no cell transfer.
FIG. 9.
Prevention of viral histopathology by adoptive transfer of sort-purified IE1 epitope-specific CD8-TM. Protection is documented for two key target organs of CMV disease by immunohistological detection of infected tissue cells (the same experiment as was shown in Fig. 8). (A and C) Whole-organ sections of adrenal (suprarenal) glands after no cell transfer and after cell transfer, respectively. (B and D) Liver sections after no cell transfer and after cell transfer, respectively. Panel B1 shows massive liver infection in an overview. The arrow points to a plaque-like lesion that is resolved to greater detail in panel B2. Infected cells were identified by black staining (peroxidase-diaminobenzidine-nickel method with hematoxylin counterstaining) of the IE1 protein that accumulates in the late stage of infection in an intranuclear inclusion body. Bars, 100 μm.
FIG. 10.
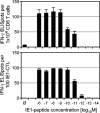
IE1 peptide sensitivity of CD8-TM and the corresponding CTLL. CD8 T cells isolated from spleens of three mice at 3 months after infection and the third-restimulation IE1-CTLL derived thereof were tested for antigen sensitivity by an IFN-γ-based ELISPOT assay with the indicated concentrations of synthetic IE1 peptide for stimulation. Cell numbers seeded were 4 × 10⁴, 2 × 10⁴, 1 × 10⁴, and 5 × 10³ in the case of ex vivo memory cells and 200, 150, 100, and 50 cells in the case of the IE1-CTLL. Group ⊘, stimulator cells with no peptide added; black bars, MPNs, determined by intercept-free linear regression analysis; error bars, upper 95% confidence limits.
FIG. 11.
Specificity composition of a CD8-TM population. Frequencies of mCMV epitope-specific CD8-TM isolated from spleens of three mice at 3 months after infection were determined by an ELISPOT assay based on secretion of IFN-γ after stimulation with optimal concentrations of the antigenic peptides indicated. Peptides are ranked according to response magnitude. Group ⊘, stimulator cells with no peptide added. For statistical calculations, see the legend to Fig. 10.
FIG. 12.
Presort and postsort quantitative analysis of CD8 T cells. Immunomagnetically preenriched CD8 T cells derived from 10 memory spleens at 3 months after infection (same group of primed mice as in the results shown in Fig. 11) were analyzed for the expression of CD8 and IE1 epitope-specific TCRs before and after high-speed cytofluorometric cell sorting. LdDimer-IE1mCMV was used for the epitope-specific TCR labeling. In a first round of sorting, a sort window (indicated in the upper-left dot plot) was set on cells with the phenotype IE1-TCRhigh CD8+. In a second round of sorting, a sort window (indicated in the upper-right dot plot) was set on cells with the phenotype IE1-TCR− CD8+. Displayed are dot plots of two-color cytofluorometric analyses with CD8 expression shown by FITC fluorescence (FL-1) intensity on the abscissa and IE1-TCR expression by PE-fluorescence (FL-2) intensity on the ordinate. Dots represent 105,332 cells (presort, upper-left dot plot), 93 cells (postsort, lower-left dot plot), 16,843 cells (presort, upper-right dot plot), and 346 cells (postsort, lower-right dot plot). Percentages of cells present in the quadrants are indicated.
FIG. 13.
Comparison of the in vivo antiviral activities of sort-purified IE1-TCR+ and IE1-TCR− CD8 T cells. The indicated graded numbers of CD8 T cells derived from the cell sorting (Fig. 12) were adoptively transferred into immunocompromised BALB/cJ recipients. On day 12 after cell transfer, virus titers were determined in lung and spleen of the recipients, and the numbers of infected cells were determined for the liver and the adrenal glands in representative 10 mm2- by 2-μm and 2 mm2- by 2-μm tissue sections, respectively. Symbols represent individual transfer recipients with the median values marked. Dotted regression lines indicate the dose-response relation. Closed and open circles represent recipients of IE1-TCR+ and IE1-TCR− CD8 T cells, respectively. Group ⊘ (open squares), no cell transfer.
Similar articles
- Phenotypic and functional characterization of CD8(+) T cell clones specific for a mouse cytomegalovirus epitope.
Fernandez JA, Zavala F, Tsuji M. Fernandez JA, et al. Virology. 1999 Mar 1;255(1):40-9. doi: 10.1006/viro.1998.9575. Virology. 1999. PMID: 10049820 - CD8 T cells control cytomegalovirus latency by epitope-specific sensing of transcriptional reactivation.
Simon CO, Holtappels R, Tervo HM, Böhm V, Däubner T, Oehrlein-Karpi SA, Kühnapfel B, Renzaho A, Strand D, Podlech J, Reddehase MJ, Grzimek NK. Simon CO, et al. J Virol. 2006 Nov;80(21):10436-56. doi: 10.1128/JVI.01248-06. Epub 2006 Aug 23. J Virol. 2006. PMID: 16928768 Free PMC article. - Experimental preemptive immunotherapy of murine cytomegalovirus disease with CD8 T-cell lines specific for ppM83 and pM84, the two homologs of human cytomegalovirus tegument protein ppUL83 (pp65).
Holtappels R, Podlech J, Grzimek NK, Thomas D, Pahl-Seibert MF, Reddehase MJ. Holtappels R, et al. J Virol. 2001 Jul;75(14):6584-600. doi: 10.1128/JVI.75.14.6584-6600.2001. J Virol. 2001. PMID: 11413326 Free PMC article. - Refining human T-cell immunotherapy of cytomegalovirus disease: a mouse model with 'humanized' antigen presentation as a new preclinical study tool.
Lemmermann NA, Reddehase MJ. Lemmermann NA, et al. Med Microbiol Immunol. 2016 Dec;205(6):549-561. doi: 10.1007/s00430-016-0471-0. Epub 2016 Aug 18. Med Microbiol Immunol. 2016. PMID: 27539576 Review. - Selective reconstitution of CD8+ cytotoxic T lymphocyte responses in immunodeficient bone marrow transplant recipients by the adoptive transfer of T cell clones.
Riddell SR, Walter BA, Gilbert MJ, Greenberg PD. Riddell SR, et al. Bone Marrow Transplant. 1994;14 Suppl 4:S78-84. Bone Marrow Transplant. 1994. PMID: 7728132 Review.
Cited by
- Cytomegalovirus memory inflation and immune protection.
Cicin-Sain L. Cicin-Sain L. Med Microbiol Immunol. 2019 Aug;208(3-4):339-347. doi: 10.1007/s00430-019-00607-8. Epub 2019 Apr 10. Med Microbiol Immunol. 2019. PMID: 30972476 Review. - Memory inflation during chronic viral infection is maintained by continuous production of short-lived, functional T cells.
Snyder CM, Cho KS, Bonnett EL, van Dommelen S, Shellam GR, Hill AB. Snyder CM, et al. Immunity. 2008 Oct 17;29(4):650-9. doi: 10.1016/j.immuni.2008.07.017. Immunity. 2008. PMID: 18957267 Free PMC article. - Cytomegalovirus Reinfections Stimulate CD8 T-Memory Inflation.
Trgovcich J, Kincaid M, Thomas A, Griessl M, Zimmerman P, Dwivedi V, Bergdall V, Klenerman P, Cook CH. Trgovcich J, et al. PLoS One. 2016 Nov 21;11(11):e0167097. doi: 10.1371/journal.pone.0167097. eCollection 2016. PLoS One. 2016. PMID: 27870919 Free PMC article. - Mutual Interference between Cytomegalovirus and Reconstitution of Protective Immunity after Hematopoietic Cell Transplantation.
Reddehase MJ. Reddehase MJ. Front Immunol. 2016 Aug 4;7:294. doi: 10.3389/fimmu.2016.00294. eCollection 2016. Front Immunol. 2016. PMID: 27540380 Free PMC article. Review. - Subdominant CD8 T-cell epitopes account for protection against cytomegalovirus independent of immunodomination.
Holtappels R, Simon CO, Munks MW, Thomas D, Deegen P, Kühnapfel B, Däubner T, Emde SF, Podlech J, Grzimek NK, Oehrlein-Karpi SA, Hill AB, Reddehase MJ. Holtappels R, et al. J Virol. 2008 Jun;82(12):5781-96. doi: 10.1128/JVI.00155-08. Epub 2008 Mar 26. J Virol. 2008. PMID: 18367531 Free PMC article.
References
- Boniface, J. J., J. D. Rabinowitz, C. Wulfing, J. Hampl, Z. Reich, J. D. Altman, R. M. Kantor, C. Beeson, H. M. McConnell, and M. M. Davis. 1998. Initiation of signal transduction through the T cell receptor requires the multivalent engagement of peptide/MHC ligands. Immunity 9:459-466. (Erratum, 9:891.) - PubMed
- Borysiewicz, L. K., J. K. Hickling, S. Graham, J. Sinclair, M. P. Cranage, G. L. Smith, and J. G. P. Sissons. 1988. Human cytomegalovirus-specific cytotoxic T cells. Relative frequency of stage-specific CTL recognizing the 72-kD immediate-early protein and glycoprotein B expressed by recombinant vaccinia viruses. J. Exp. Med. 168:919-931. - PMC - PubMed
- Cochran, J. R., T. O. Cameron, and L. J. Stern. 2000. The relationship of MHC-peptide binding and T cell activation probed using chemically defined MHC class II oligomers. Immunity 12:241-250. - PubMed
Publication types
MeSH terms
Substances
LinkOut - more resources
Full Text Sources
Other Literature Sources
Molecular Biology Databases
Research Materials

