Microcytic anemia, erythropoietic protoporphyria, and neurodegeneration in mice with targeted deletion of iron-regulatory protein 2 - PubMed (original) (raw)
Microcytic anemia, erythropoietic protoporphyria, and neurodegeneration in mice with targeted deletion of iron-regulatory protein 2
Sharon S Cooperman et al. Blood. 2005.
Abstract
Iron-regulatory proteins (IRPs) 1 and 2 posttranscriptionally regulate expression of transferrin receptor (TfR), ferritin, and other iron metabolism proteins. Mice with targeted deletion of IRP2 overexpress ferritin and express abnormally low TfR levels in multiple tissues. Despite this misregulation, there are no apparent pathologic consequences in tissues such as the liver and kidney. However, in the central nervous system, evidence of abnormal iron metabolism in IRP2-/- mice precedes the development of adult-onset progressive neurodegeneration, characterized by widespread axonal degeneration and neuronal loss. Here, we report that ablation of IRP2 results in iron-limited erythropoiesis. TfR expression in erythroid precursors of IRP2-/- mice is reduced, and bone marrow iron stores are absent, even though transferrin saturation levels are normal. Marked overexpression of 5-aminolevulinic acid synthase 2 (Alas2) results from loss of IRP-dependent translational repression, and markedly increased levels of free protoporphyrin IX and zinc protoporphyrin are generated in IRP2-/- erythroid cells. IRP2-/- mice represent a new paradigm of genetic microcytic anemia. We postulate that IRP2 mutations or deletions may be a cause of refractory microcytic anemia and bone marrow iron depletion in patients with normal transferrin saturations, elevated serum ferritins, elevated red cell protoporphyrin IX levels, and adult-onset neurodegeneration.
Figures
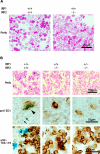
Figure 1.
Bone marrow iron is absent in bone marrow aspirates and sections of IRP2-/- and IRP1+/- IRP2-/- mice. Perls stain (Prussian blue with safranin counter-stain) of WT (IRP1+/+ IRP2+/+) shows abundant iron stores, whereas iron is virtually undetectable in bone marrow aspirates of IRP1+/+ IRP2-/- and IRP1+/- IRP2-/- animals (A). In lightly fixed bone marrow biopsies, iron is visible in WT but not in IRP2-/- and IRP1+/- IRP2-/- animals (top panel, B). On higher magnification, iron is detectable in WT macrophages (arrowhead points to blue iron deposits within brown cell identified as a macrophage by antibody to ED1 in middle row, B) and as siderotic granules in erythroid precursors (arrows). In bottom panel, antibody to TER-119 indicates erythroid lineage cells, but siderotic granules cannot be seen because the brown anti-TER-119 stain obscures them. Bone sections were obtained from age-matched 12-month-old females. Imaging was performed using a Nikon Eclipse E600 microscope (Nikon Instruments, Melville, NY) equipped with a 10×/0.45 objective lens (B, top panels) or a 60×/1.4 oil-immersion objective lens along with Nikon Type A immersion oil (A; B, middle and bottom panels). Images were captured with a Nikon DXM 1200F digital camera and Nikon ACT-1 2.62 imaging software. Images were processed with Adobe Photoshop 7.0 (Adobe Systems, San Jose, CA) and Adobe Illustrator 10.0 software programs.
Figure 2.
TfR levels are low in IRP2-/- and IRP1+/- IRP2-/- erythroid bone marrow precursor cells, whereas ferritin levels are elevated. Erythroid lineage cells were removed from mouse femurs and 5 μg lysate of the designated genotype were separated by SDS-PAGE and detected by Western blotting as described in “Materials and methods.”
Figure 3.
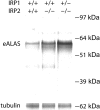
Erythroid ALAS biosynthesis levels are markedly increased in IRP2-/- and IRP1+/- IRP2-/- erythroid cells. Erythoid lineage cells were isolated from mouse bone marrow, and Alas2 was immunoprecipitated and separated by SDS-PAGE from radiolabeled cells as described in “Materials and methods.”
Figure 4.
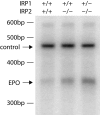
Kidney erythropoietin transcript levels are increased in IRP2-/- and IRP1+/- IRP2-/- mice. RNA extracted from kidneys of WT, IRP2-/-, and IRP1+/- IRP2-/- mice was assessed by relative quantitative PCR as described in “Materials and methods.” As a control, the 18S ribosomal subunit was amplified (top arrow) and erythropoietin mRNA (Epo) was amplified simultaneously (bottom arrow), indicating that erythropoietin mRNA levels increase significantly in kidneys of IRP2-/- animals and more prominently in IRP1+/- IRP2-/- mice. bp indicates base pair.
Figure 5.
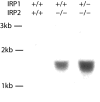
Hydroxymethylbilane synthase mRNA levels are increased in RNA preparations from IRP2-/- IRP1+/- IRP2-/- spleens. Spleen RNA was prepared and Northern blots were probed for levels of hydroxymethylbilane synthase, as described in “Materials and methods.” To evaluate total iron (heme and nonheme) content of tissues in IRP2-/- mice, we performed ashing and analyzed total iron levels in spleen, brain, and liver (Table 4). Total spleen iron was unchanged in IRP2-/- and IRP1+/- IRP2-/- mice relative to WT controls. Total brain iron was also unchanged, while total liver iron was increased in IRP1+/- IRP2-/- mice relative to wild type. Kb indicates kilobase.
Similar articles
- Complete loss of iron regulatory proteins 1 and 2 prevents viability of murine zygotes beyond the blastocyst stage of embryonic development.
Smith SR, Ghosh MC, Ollivierre-Wilson H, Hang Tong W, Rouault TA. Smith SR, et al. Blood Cells Mol Dis. 2006 Mar-Apr;36(2):283-7. doi: 10.1016/j.bcmd.2005.12.006. Epub 2006 Feb 15. Blood Cells Mol Dis. 2006. PMID: 16480904 - Tempol-mediated activation of latent iron regulatory protein activity prevents symptoms of neurodegenerative disease in IRP2 knockout mice.
Ghosh MC, Tong WH, Zhang D, Ollivierre-Wilson H, Singh A, Krishna MC, Mitchell JB, Rouault TA. Ghosh MC, et al. Proc Natl Acad Sci U S A. 2008 Aug 19;105(33):12028-33. doi: 10.1073/pnas.0805361105. Epub 2008 Aug 6. Proc Natl Acad Sci U S A. 2008. PMID: 18685102 Free PMC article. - Erythropoiesis and iron metabolism in dominant erythropoietic protoporphyria.
Holme SA, Worwood M, Anstey AV, Elder GH, Badminton MN. Holme SA, et al. Blood. 2007 Dec 1;110(12):4108-10. doi: 10.1182/blood-2007-04-088120. Epub 2007 Sep 5. Blood. 2007. PMID: 17804693 - Iron misregulation and neurodegenerative disease in mouse models that lack iron regulatory proteins.
Ghosh MC, Zhang DL, Rouault TA. Ghosh MC, et al. Neurobiol Dis. 2015 Sep;81:66-75. doi: 10.1016/j.nbd.2015.02.026. Epub 2015 Mar 11. Neurobiol Dis. 2015. PMID: 25771171 Free PMC article. Review. - The IRP/IRE system in vivo: insights from mouse models.
Wilkinson N, Pantopoulos K. Wilkinson N, et al. Front Pharmacol. 2014 Jul 28;5:176. doi: 10.3389/fphar.2014.00176. eCollection 2014. Front Pharmacol. 2014. PMID: 25120486 Free PMC article. Review.
Cited by
- Cellular and mitochondrial iron homeostasis in vertebrates.
Chen C, Paw BH. Chen C, et al. Biochim Biophys Acta. 2012 Sep;1823(9):1459-67. doi: 10.1016/j.bbamcr.2012.01.003. Epub 2012 Jan 18. Biochim Biophys Acta. 2012. PMID: 22285816 Free PMC article. Review. - Disruption of cellular iron homeostasis by IREB2 missense variants causes severe neurodevelopmental delay, dystonia and seizures.
Maio N, Saneto RP, Steet R, Sotero de Menezes MA, Skinner C, Rouault TA. Maio N, et al. Brain Commun. 2022 Apr 19;4(3):fcac102. doi: 10.1093/braincomms/fcac102. eCollection 2022. Brain Commun. 2022. PMID: 35602653 Free PMC article. - The long history of iron in the Universe and in health and disease.
Sheftel AD, Mason AB, Ponka P. Sheftel AD, et al. Biochim Biophys Acta. 2012 Mar;1820(3):161-87. doi: 10.1016/j.bbagen.2011.08.002. Epub 2011 Aug 9. Biochim Biophys Acta. 2012. PMID: 21856378 Free PMC article. Review. - Discovery of genes essential for heme biosynthesis through large-scale gene expression analysis.
Nilsson R, Schultz IJ, Pierce EL, Soltis KA, Naranuntarat A, Ward DM, Baughman JM, Paradkar PN, Kingsley PD, Culotta VC, Kaplan J, Palis J, Paw BH, Mootha VK. Nilsson R, et al. Cell Metab. 2009 Aug;10(2):119-30. doi: 10.1016/j.cmet.2009.06.012. Cell Metab. 2009. PMID: 19656490 Free PMC article. - Duodenal cytochrome b (DCYTB) in iron metabolism: an update on function and regulation.
Lane DJ, Bae DH, Merlot AM, Sahni S, Richardson DR. Lane DJ, et al. Nutrients. 2015 Mar 31;7(4):2274-96. doi: 10.3390/nu7042274. Nutrients. 2015. PMID: 25835049 Free PMC article. Review.
References
- Rouault T, Klausner R. Regulation of iron metabolism in eukaryotes. Curr Top Cell Regul. 1997;35: 1-19. - PubMed
- Hentze MW, Muckenthaler MU, Andrews NC. Balancing acts: molecular control of mammalian iron metabolism. Cell. 2004;117: 285-297. - PubMed
- Ganz T. Hepcidin, a key regulator of iron metabolism and mediator of anemia of inflammation. Blood. 2003;102: 783-788. - PubMed
- Aisen P. Transferrin, the transferrin receptor, and the uptake of iron by cells. Met Ions Biol Syst. 1998;35: 585-631. - PubMed
- Touret N, Furuya W, Forbes J, Gros P, Grinstein S. Dynamic traffic through the recycling compartment couples the metal transporter Nramp2 (DMT1) with the transferrin receptor. J Biol Chem. 2003;278: 25548-25557. - PubMed
Publication types
MeSH terms
Substances
LinkOut - more resources
Full Text Sources
Medical
Molecular Biology Databases


