A developmental switch in the response of DRG neurons to ETS transcription factor signaling - PubMed (original) (raw)
A developmental switch in the response of DRG neurons to ETS transcription factor signaling
Simon Hippenmeyer et al. PLoS Biol. 2005 May.
Abstract
Two ETS transcription factors of the Pea3 subfamily are induced in subpopulations of dorsal root ganglion (DRG) sensory and spinal motor neurons by target-derived factors. Their expression controls late aspects of neuronal differentiation such as target invasion and branching. Here, we show that the late onset of ETS gene expression is an essential requirement for normal sensory neuron differentiation. We provide genetic evidence in the mouse that precocious ETS expression in DRG sensory neurons perturbs axonal projections, the acquisition of terminal differentiation markers, and their dependence on neurotrophic support. Together, our findings indicate that DRG sensory neurons exhibit a temporal developmental switch that can be revealed by distinct responses to ETS transcription factor signaling at sequential steps of neuronal maturation.
Figures
Figure 1. Replacement of Er81 by EWS-Pea3
(A) Generation of Er81EWS-Pea3 mutant mice. Above is the organization of the Er81 genomic locus in the region targeted by homologous recombination in analogy to [14]. Exons 1–4 are shown as light blue boxes, and the Er81 start codon in exon 2 is indicated as ATG. The probe used to detect homologous recombination is shown as a grey box. Below is replacement of Er81 by EWS-Pea3 through the integration of EWS-Pea3 in frame with the endogenous start codon of the Er81 locus in exon 2 (in analogy to [14]). (B) PCR and Southern blot analysis of Er81EWS-Pea3 wild-type (+/+), heterozygous (+/−), and homozygous (−/−) genomic DNA to detect the mutant allele. PCR primer pairs (EWS-Pea3ki) were used to detect specifically the recombined allele, and a primer pair in exon2 was used to detect the presence of the wild-type allele [14]. (C–E) Analysis of Er81 expression in lumbar DRG neurons of E16.5 wild-type (C), Er81−/− (D), and Er81EWS-Pea3/− (E) embryos. Inset in lower right corner of each panel shows Isl1 expression in the respective DRG. (F–H) PV expression in lumbar DRG of E16.5 wild-type (F), Er81−/− (G), and Er81EWS-Pea3/− (H) embryos. Confocal scans were performed with equal gain intensity. (J) Transcriptional transactivation of luciferase expression from a minimal reporter construct containing five consensus ETS DNA-binding sites ( GCCGGAAGC; [18,19]) and a minimal TK promoter upon transient transfection of Er81 (n ≥ 7; 3.03 ± 0.66) or EWS-Pea3 (n ≥ 7; 20.3 ± 2.7). Relative luciferase activity normalized to control (Con). Scale bar: 80 μm.
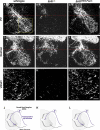
Figure 2. Rescue of Ia Proprioceptive Afferent Projections into the Ventral Spinal Cord in Er81EWS-Pea3 Mutants
(A–F) Morphological analysis of central projections at lumbar level L3 of PV+ DRG neurons (A–C) or all DRG sensory afferents after application of fluorescently labeled dextran to individual dorsal roots (D–F) in P0.5 (A–C) or P5 (D–F) wild-type (A and D), Er81−/− (B and E), and Er81EWS-Pea3/− (C and F) mice. Red dotted line indicates intermediate level of spinal cord. (G–I) Analysis of vGlut1 immunocytochemistry in the ventral horn of P0.5 wild-type (G), Er81−/− (H), and Er81EWS-Pea3/− (I) mice. Yellow dotted box in (A) indicates size of images shown in (G–I). (J–L) Schematic summary diagrams of the morphological rescue of Ia proprioceptive afferent projections (blue) into the ventral spinal cord observed in wild-type (J), Er81−/− (K), and Er81EWS-Pea3/− (L) mice. DRG indicated by dotted grey line; motor neurons are shown in black. Scale bar: (A–C), 150 μm; (D–F), 160 μm; (G–I), 70 μm.
Figure 3. Defects in the Establishment of Sensory Afferent Projections upon Precocious Expression of EWS-Pea3 in DRG Neurons
(A–C and G–I) Visualization of sensory afferent projections (green) into the spinal cord of wild-type (A–C) and TauEWS-Pea3/+ Isl1Cre/+ (G–I) embryos at E13.5 (A, C, G, and I) and E16.5 (B and H) by Cre-recombinase-mediated activation of mGFP expression from the Tau locus (A, B, G, and H) or by a Thy1spGFP transgene (C and I; [25]). Grey arrows indicate normal pattern of afferent projections into the spinal cord, whereas red arrows show aberrant accumulation of sensory afferents at the lateral edge of the spinal cord in TauEWS-Pea3/+ Isl1Cre/+ embryos. (D–F and J–L) Analysis of sensory afferent projections (green) into the skin (D and J) or muscle (E and K; red, α-Bungarotoxin, BTX) of wild-type (D–F) and TauEWS-Pea3/+ Isl1Cre/+ (J–L) embryos at E16.5 by Cre-recombinase-mediated activation of mGFP (D, E, J, and K) expression from the Tau locus. (F and L) show Egr3 expression in intrafusal muscle fibers using in situ hybridization (consecutive sections to [E and K] are shown). (M–Q) Analysis of bifurcation of sensory afferent projections towards the spinal cord in E13.5 wild-type (M) and TauEWS-Pea3/+ Isl1Cre/+ (O and Q) embryos after injection of fluorescently labeled dextran (green) into one DRG (lumbar level L3). Confocal scanning plane for (M and O) is schematically illustrated in (N). Inset in (O) is also shown at a deeper confocal scanning plane (P and Q) to visualize aberrant axonal projections. Scale bar: (A and G), 60 μm; (B and H), 80 μm; (C and I), 100 μm; (D and J), 160 μm; (E, F, K, and L), 70 μm; (M, O, and Q), 240 μm.
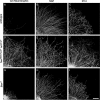
Figure 4. Neurotrophin-Independent Neurite Outgrowth In Vitro of DRG Neurons Expressing EWS-Pea3 Precociously
E13.5 lumbar DRG from wild-type (A, B, and C), TauEWS-Pea3/+ Isl1Cre/+ (D, E, and F), or Bax−/− (G, H, and I) embryos cultured for 48 h without neurotrophic support (A, D, and G) or in the presence of NGF (B, E, and H) or NT-3 (C, F, and I) were stained for expression of neurofilament to visualize axonal extensions. Scale bar: 130 μm.
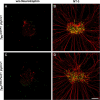
Figure 5. DRG Neurons Expressing EWS-Pea3 Isochronically Depend on Neurotrophins for Survival
E14.5 lumbar DRG from TaumGFP/+ PVCre/+ (A and B) and TauEWS-Pea3/+ PVCre/+ (C and D) embryos cultured for 48 h without neurotrophic support (A and C) or in the presence of NT-3 (B and D) were stained for expression of neurofilament (red) and LacZ (green) to visualize axonal extensions and survival of PV-expressing proprioceptive afferents. Scale bar: 150 μm.
Figure 6. Loss of Trk Receptor Expression and Increased Survival in DRG Neurons upon Precocious ETS Signaling
(A–C and G–I) In situ hybridization analysis of TrkA (A and G), TrkB (B and H), and TrkC (C and I) expression in E16.5 lumbar DRG of wild-type (A–C) and TauEWS-Pea3/+ Isl1Cre/+ (G–I) embryos. (D–F and J–L) Analysis of lumbar DRG of wild-type (D), TaumGFP/+ IslCre/+ (E and F), and TauEWS-Pea3/+ Isl1Cre/+ (J, K, and L) embryos for (1) neuronal cell death at E13.5 by TUNEL (green; D and J), (2) cell survival and proliferation at E16.5 by LacZ (blue) wholemount staining (E and K; lumbar levels L1 and L2 are shown), and (3) BrdU (green)/LacZ (red) double labeling (F and L). (M and N) Quantitative analysis (n ≥ 3 independent experiments) of the mean number of apoptotic events relative to wild-type levels is shown in (M) and neuronal survival in (N) as percent of wild-type of DRG at lumbar levels L1 to L5 as quantified on serial sections. (O) Western blot analysis of protein extracts isolated from lumbar DRG of E16.5 wild-type (wt) and TauEWS-Pea3/+ Isl1Cre/+ (mut) embryos using the following antibodies: Akt, p-Akt (Ser473), CREB, p-CREB (Ser133), Bax, Bcl2, and Bcl-xl. (P) Quantitative analysis of protein levels relative to wild-type in percent is shown on the right (n = 3 independent experiments). Scale bar: (A–C and G–I), 35 μm; (D and J), 40 μm; (E and K), 200 μm; (F and L), 50 μm.
Figure 7. Gene Expression Analysis upon Induction of Precocious or Isochronic ETS Signaling
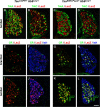
(A–H) Analysis of TrkC expression by in situ hybridization (A–D), or Calretinin (red) and LacZ (green) expression by immunohistochemistry (E–H), on E16.5 lumbar DRG of wild-type (A and E), TauEWS-Pea3/+ Isl1Cre/+ (B and F), Er81EWS-Pea3/− (C and G), and TauEWS-Pea3/+ PVCre/+ (D and H) embryos. (I) Summary diagram illustrating deregulation of TrkC (red arrows, downregulation) and Calretinin (green arrows, upregulation) expression upon precocious (B and F) induction of EWS-Pea3 expression in DRG neurons (B and F; E10–E11, i.e., shortly after cell cycle exit, E9.5–E10). In contrast, activation of EWS-Pea3 from the endogenous Er81 locus (C and G; E12.5–E13) or via Cre recombinase expression from the PV locus activating late expression from the Tau locus (D and H; E14.5) does not interfere with the normal expression of TrkC and Calretinin (shown in grey). Scale bar: (A–D), 65 μm; (E–H), 80 μm.
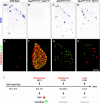
Figure 8. Precocious ETS Signaling Induces Gene Expression Changes Cell-Autonomously
(A–D) Expression of TrkA (A and C; green) or TrkC (B and D; green), and LacZ (red), in E16.5 lumbar DRG of TaumGFP/+ Hb9Cre/+ (A and B) and TauEWS-Pea3/+ Hb9Cre/+ (C and D) embryos. (E–L) Expression of Calretinin (green), LacZ (red), and Isl1 (F, J, H, and L; blue) in E16.5 brachial (E–H) and lumbar (I–L) DRG of TaumGFP/+ Hb9Cre/+ (E, F, I, and J) and TauEWS-Pea3/+ Hb9Cre/+ (G, H, K, and L) embryos. Scale bar: (A–D), 80 μm; (E–L), 70 μm.
Figure 9. Progressive Neuronal Specification Is Paralleled by a Developmental Shift in Response to ETS Transcription Factor Signaling
Schematic summary diagram illustrating the importance of temporally appropriate upregulation of transcription factor expression during specification of DRG neurons for late aspects of neuronal differentiation and circuit assembly. (A–D) Expression of EWS-Pea3 from the endogenous Er81 locus can rescue anatomical defects observed in Er81−/− mice, and no change in expression of TrkC (green) or Calretinin (CR; grey) is observed in proprioceptive afferents (A, B, and D). In contrast, precocious ETS signaling leads to severe defects in the establishment of DRG neuronal projections accompanied by inappropriate gene expression changes (C; upregulation of CR (red) and downregulation of TrkC [grey]). (E) Precocious ETS signaling (red) during progressive specification of proprioceptive sensory neurons leads to aberrant neuronal differentiation (red dashed line). In contrast, the isochronic, target-induced (green; peripheral signal) onset of ETS transcription factor signaling (black) induces appropriate terminal neuronal differentiation (blue).
Similar articles
- Dynamic regulation of the expression of neurotrophin receptors by Runx3.
Nakamura S, Senzaki K, Yoshikawa M, Nishimura M, Inoue K, Ito Y, Ozaki S, Shiga T. Nakamura S, et al. Development. 2008 May;135(9):1703-11. doi: 10.1242/dev.015248. Epub 2008 Apr 2. Development. 2008. PMID: 18385258 - Onset of ETS expression is not accelerated by premature exposure to signals from limb mesenchyme.
Wang G, Scott SA. Wang G, et al. Dev Dyn. 2007 Aug;236(8):2109-17. doi: 10.1002/dvdy.21236. Dev Dyn. 2007. PMID: 17654714 - Activating transcription factor 3 (ATF3) induction by axotomy in sensory and motoneurons: A novel neuronal marker of nerve injury.
Tsujino H, Kondo E, Fukuoka T, Dai Y, Tokunaga A, Miki K, Yonenobu K, Ochi T, Noguchi K. Tsujino H, et al. Mol Cell Neurosci. 2000 Feb;15(2):170-82. doi: 10.1006/mcne.1999.0814. Mol Cell Neurosci. 2000. PMID: 10673325 - Role of neurotrophin signalling in the differentiation of neurons from dorsal root ganglia and sympathetic ganglia.
Ernsberger U. Ernsberger U. Cell Tissue Res. 2009 Jun;336(3):349-84. doi: 10.1007/s00441-009-0784-z. Epub 2009 Apr 23. Cell Tissue Res. 2009. PMID: 19387688 Review. - Development and specification of muscle sensory neurons.
Chen HH, Frank E. Chen HH, et al. Curr Opin Neurobiol. 1999 Aug;9(4):405-9. doi: 10.1016/S0959-4388(99)80061-0. Curr Opin Neurobiol. 1999. PMID: 10448156 Review.
Cited by
- A motor cortex circuit for motor planning and movement.
Li N, Chen TW, Guo ZV, Gerfen CR, Svoboda K. Li N, et al. Nature. 2015 Mar 5;519(7541):51-6. doi: 10.1038/nature14178. Epub 2015 Feb 25. Nature. 2015. PMID: 25731172 - Motor Control of Distinct Layer 6 Corticothalamic Feedback Circuits.
Martinetti LE, Autio DM, Crandall SR. Martinetti LE, et al. eNeuro. 2024 Jul 9;11(7):ENEURO.0255-24.2024. doi: 10.1523/ENEURO.0255-24.2024. Print 2024 Jul. eNeuro. 2024. PMID: 38926084 Free PMC article. - Deciphering the Neuronal Circuitry Controlling Local Blood Flow in the Cerebral Cortex with Optogenetics in PV::Cre Transgenic Mice.
Urban A, Rancillac A, Martinez L, Rossier J. Urban A, et al. Front Pharmacol. 2012 Jun 15;3:105. doi: 10.3389/fphar.2012.00105. eCollection 2012. Front Pharmacol. 2012. PMID: 22715327 Free PMC article. - Spatial Embedding and Wiring Cost Constrain the Functional Layout of the Cortical Network of Rodents and Primates.
Horvát S, Gămănuț R, Ercsey-Ravasz M, Magrou L, Gămănuț B, Van Essen DC, Burkhalter A, Knoblauch K, Toroczkai Z, Kennedy H. Horvát S, et al. PLoS Biol. 2016 Jul 21;14(7):e1002512. doi: 10.1371/journal.pbio.1002512. eCollection 2016 Jul. PLoS Biol. 2016. PMID: 27441598 Free PMC article. - Independent Neuronal Origin of Seizures and Behavioral Comorbidities in an Animal Model of a Severe Childhood Genetic Epileptic Encephalopathy.
Asinof SK, Sukoff Rizzo SJ, Buckley AR, Beyer BJ, Letts VA, Frankel WN, Boumil RM. Asinof SK, et al. PLoS Genet. 2015 Jun 30;11(6):e1005347. doi: 10.1371/journal.pgen.1005347. eCollection 2015 Jun. PLoS Genet. 2015. PMID: 26125563 Free PMC article.
References
- Edlund T, Jessell TM. Progression from extrinsic to intrinsic signaling in cell fate specification: A view from the nervous system. Cell. 1999;96:211–224. - PubMed
- Anderson DJ, Groves A, Lo L, Ma Q, Rao M, et al. Cell lineage determination and the control of neuronal identity in the neural crest. Cold Spring Harb Symp Quant Biol. 1997;62:493–504. - PubMed
- Knecht AK, Bronner-Fraser M. Induction of the neural crest: A multigene process. Nat Rev Genet. 2002;3:453–461. - PubMed
- Bibel M, Barde YA. Neurotrophins: Key regulators of cell fate and cell shape in the vertebrate nervous system. Genes Dev. 2000;14:2919–2937. - PubMed
Publication types
MeSH terms
Substances
LinkOut - more resources
Full Text Sources
Other Literature Sources
Molecular Biology Databases

