Sex differences in transgenerational alterations of growth and metabolism in progeny (F2) of female offspring (F1) of rats fed a low protein diet during pregnancy and lactation - PubMed (original) (raw)
Sex differences in transgenerational alterations of growth and metabolism in progeny (F2) of female offspring (F1) of rats fed a low protein diet during pregnancy and lactation
E Zambrano et al. J Physiol. 2005.
Abstract
Compelling epidemiological and experimental evidence indicates that a suboptimal environment during fetal and neonatal development in both humans and animals may programme offspring susceptibility to later development of several chronic diseases including obesity and diabetes in which altered carbohydrate metabolism plays a central role. One of the most interesting and significant features of developmental programming is the evidence from several studies that the adverse consequences of altered intrauterine environments can be passed transgenerationally from mother (F0) to daughter (F1) to second generation offspring (F2). We determined whether when F0 female rats are exposed to protein restriction during pregnancy and/or lactation their F1 female pups deliver F2 offspring with in vivo evidence of altered glucose and insulin metabolism. We fed F0 virgin Wistar rats a normal control 20% casein diet (C) or a protein restricted isocaloric diet (R) containing 10% casein during pregnancy. F1 female R pups weighed less than C at birth. After delivery, mothers received C or R diet during lactation to provide four F1 offspring groups CC (first letter pregnancy diet and second lactation diet), RR, CR and RC. All F1 female offspring were fed ad libitum with C diet after weaning and during their first pregnancy and lactation. As they grew female offspring (F1) of RR and CR mothers exhibited low body weight and food intake with increased sensitivity to insulin during a glucose tolerance test at 110 days of postnatal life. Male F2 CR offspring showed evidence of insulin resistance. In contrast RC F2 females showed evidence of insulin resistance. Sex differences were also observed in F2 offspring in resting glucose and insulin and insulin: glucose ratios. These sex differences also showed differences specific to stage of development time window. We conclude that maternal protein restriction adversely affects glucose and insulin metabolism of male and female F2 offspring in a manner specific to sex and developmental time window during their mother's (the F1) fetal and neonatal development.
Figures
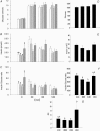
Figure 1. Results from the glucose tolerance tests performed in the F1 females at 110 days of postnatal life
A, serum glucose; B, serum insulin; C, insulin to glucose ratio; D, area under curve for serum glucose during glucose tolerance tests; E, area under curve for insulin; F, area under curve for insulin: glucose ratio; G, insulin resistance index calculated as (glucose × insulin concentration)/22.5. Data represented as means ±
s.e.m.
from 5 CC litters, 5 RR litters, 6 CR litters, and 6 RC litters. Diets of F0 mothers are denoted as control (C) or restricted (R) during pregnancy (first letter), followed by lactation (second letter). CC: control–control  ; RR: restricted–restricted
  ; CR: control–restricted
  ; RC: restricted–control
  . P > 0.05 for data with at least one letter in common.
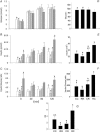
Figure 2. Results from the glucose tolerance tests performed in the F2 females at 110 days of postnatal life
A, serum glucose; B, serum insulin; C, insulin to glucose ratio; D, area under curve for serum glucose during glucose tolerance tests; E, area under curve for insulin; F, area under curve for insulin:glucose ratio; G, insulin resistance index calculated as (glucose × insulin concentration)/22.5. Data represented as means ±
s.e.m.
from 5 to 6 CC litters, 5–6 RR litters, 6 CR litters, and 4–6 RC litters. Diets of F0 mothers are denoted as control (C) or restricted (R) during pregnancy (first letter), followed by lactation (second letter). CC: control–control  ; RR: restricted–restricted
  ; CR: control–restricted
  ; RC: restricted–control
  . P > 0.05 for data with at least one letter in common. *P < 0.05 versus male.
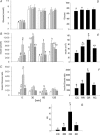
Figure 3. Results from the glucose tolerance tests performed in the F2 males at 110 days of postnatal life
A, serum glucose; B, serum insulin; C, insulin to glucose ratio; D, area under curve for serum glucose during glucose tolerance tests; E, area under curve for insulin; F, area under curve for insulin:glucose ratio; G, insulin resistance index calculated as (glucose × insulin concentration)/22.5. Data represented as means ±
s.e.m.
from 5 CC litters, 5 RR litters, 6 CR litters, and 6 RC litters. Diets of F0 mothers are denoted as control (C) or restricted (R) during pregnancy (first letter), followed by lactation (second letter). CC: control–control  ; RR: restricted–restricted
  ; CR: control–restricted
  ; RC: restricted–control
  . P > 0.05 for data with at least one letter in common. *P < 0.05 versus female.
Similar articles
- A low maternal protein diet during pregnancy and lactation has sex- and window of exposure-specific effects on offspring growth and food intake, glucose metabolism and serum leptin in the rat.
Zambrano E, Bautista CJ, Deás M, Martínez-Samayoa PM, González-Zamorano M, Ledesma H, Morales J, Larrea F, Nathanielsz PW. Zambrano E, et al. J Physiol. 2006 Feb 15;571(Pt 1):221-30. doi: 10.1113/jphysiol.2005.100313. Epub 2005 Dec 8. J Physiol. 2006. PMID: 16339179 Free PMC article. - Protein restriction during gestation and/or lactation causes adverse transgenerational effects on biometry and glucose metabolism in F1 and F2 progenies of rats.
Pinheiro AR, Salvucci ID, Aguila MB, Mandarim-de-Lacerda CA. Pinheiro AR, et al. Clin Sci (Lond). 2008 Mar;114(5):381-92. doi: 10.1042/CS20070302. Clin Sci (Lond). 2008. PMID: 17927565 - A maternal low protein diet during pregnancy and lactation in the rat impairs male reproductive development.
Zambrano E, Rodríguez-González GL, Guzmán C, García-Becerra R, Boeck L, Díaz L, Menjivar M, Larrea F, Nathanielsz PW. Zambrano E, et al. J Physiol. 2005 Feb 15;563(Pt 1):275-84. doi: 10.1113/jphysiol.2004.078543. Epub 2004 Dec 20. J Physiol. 2005. PMID: 15611025 Free PMC article. - [The transgenerational mechanisms in developmental programming of metabolic diseases].
Zambrano E. Zambrano E. Rev Invest Clin. 2009 Jan-Feb;61(1):41-52. Rev Invest Clin. 2009. PMID: 19507474 Review. Spanish. - Experimental models for studying perinatal lipid metabolism. Long-term effects of perinatal undernutrition.
Herrera E, López-Soldado I, Limones M, Amusquivar E, Ramos MP. Herrera E, et al. Adv Exp Med Biol. 2005;569:95-108. doi: 10.1007/1-4020-3535-7_14. Adv Exp Med Biol. 2005. PMID: 16137112 Review.
Cited by
- Cardio-renal and metabolic adaptations during pregnancy in female rats born small: implications for maternal health and second generation fetal growth.
Gallo LA, Tran M, Moritz KM, Mazzuca MQ, Parry LJ, Westcott KT, Jefferies AJ, Cullen-McEwen LA, Wlodek ME. Gallo LA, et al. J Physiol. 2012 Feb 1;590(3):617-30. doi: 10.1113/jphysiol.2011.219147. Epub 2011 Dec 5. J Physiol. 2012. PMID: 22144579 Free PMC article. - Gestational protein restriction reduces expression of Hsd17b2 in rat placental labyrinth.
Gao H, Yallampalli U, Yallampalli C. Gao H, et al. Biol Reprod. 2012 Sep 21;87(3):68. doi: 10.1095/biolreprod.112.100479. Print 2012 Sep. Biol Reprod. 2012. PMID: 22837477 Free PMC article. - Maternal Protein Restriction in Two Successive Generations Impairs Mitochondrial Electron Coupling in the Progeny's Brainstem of Wistar Rats From Both Sexes.
Santana DF, Ferreira DS, Braz GRF, Sousa SMS, Silva TLA, Gomes DA, Fernandes MP, Andrade-da-Costa BL, Lagranha CJ. Santana DF, et al. Front Neurosci. 2019 Mar 14;13:203. doi: 10.3389/fnins.2019.00203. eCollection 2019. Front Neurosci. 2019. PMID: 30930735 Free PMC article. - Developmental programming and hypertension.
Nuyt AM, Alexander BT. Nuyt AM, et al. Curr Opin Nephrol Hypertens. 2009 Mar;18(2):144-52. doi: 10.1097/MNH.0b013e328326092c. Curr Opin Nephrol Hypertens. 2009. PMID: 19434052 Free PMC article. Review. - Maternal high-fat diet effects on third-generation female body size via the paternal lineage.
Dunn GA, Bale TL. Dunn GA, et al. Endocrinology. 2011 Jun;152(6):2228-36. doi: 10.1210/en.2010-1461. Epub 2011 Mar 29. Endocrinology. 2011. PMID: 21447631 Free PMC article.
References
- Aerts L, Holemans K, Van Assche FA. Maternal diabetes during pregnancy: consequences for the offspring. Diabetes Metab Rev. 1990;6:147–167. - PubMed
- Aerts L, Van Assche FA. Islet transplantation in diabetic pregnant rats normalizes glucose homeostasis in their offspring. J Dev Physiol. 1992;17:283–287. - PubMed
- Barker DJ. The fetal and infant origins of disease. Eur J Clin Invest. 1995a;25:457–463. - PubMed
- Barker DJ. Intrauterine programming of adult disease. Mol Med Today. 1995b;1:418–423. - PubMed
- Dahri S, Reusens B, Remacle C, Hoet JJ. Nutritional influences on pancreatic development and potential links with non-insulin-dependent diabetes. Proc Nutr Soc. 1995;54:345–356. - PubMed
Publication types
MeSH terms
Substances
LinkOut - more resources
Full Text Sources
Medical
Research Materials
Miscellaneous


