Inflammation and primary demyelination induced by the intraspinal injection of lipopolysaccharide - PubMed (original) (raw)
Inflammation and primary demyelination induced by the intraspinal injection of lipopolysaccharide
Paul A Felts et al. Brain. 2005 Jul.
Abstract
Inflammation is a prominent feature of several disorders characterized by primary demyelination, but it is not clear whether a relationship exists between inflammation and myelin damage. We have found that substantial demyelination results from the focal inflammatory lesion caused by the injection of lipopolysaccharide (LPS; 200 ng) directly into the rat dorsal funiculus. Within 24 h, such injections caused a focal inflammatory response consisting of a substantial number of polymorphonuclear cells and ED1-positive and inducible nitric oxide synthase (iNOS)-positive macrophages/microglia. The number of inflammatory cells was substantially reduced by day 7. OX-52-positive T-cells were less frequently observed but were present in the meninges at 8 h, reached a maximum in the dorsal funiculus at 7 days, and were rare at 14 days. The inflammation was followed by the appearance of a large lesion of primary demyelination that encompassed up to approximately 75% of the cross-sectional area of the dorsal funiculus. Treatment with dexamethasone significantly reduced the number of cells expressing iNOS, but did not prevent the demyelination. By 28 days the lesions were largely remyelinated, usually by Schwann cells. These changes were not observed in control, saline-injected animals. We conclude that the intraspinal injection of LPS results in inflammation and subsequently in prominent demyelination. The mechanisms underlying the demyelination are not clear, but it is notable that it typically begins with disruption of the adaxonal myelin. Indeed, there is an early loss of myelin-associated glycoprotein within the lesion, despite the persistence of proteolipid protein. This combination is a feature of the pattern III lesion recently described in multiple sclerosis (Lucchinetti et al., 2000), and we therefore suggest that LPS-induced demyelination may serve as the first experimental model available for the study of this type of multiple sclerosis lesion.
Figures
Fig. 1
Light micrograph showing a portion of the left dorsal funiculus (margin delineated by arrowheads), and adjacent grey matter, at the approximate site of an injection of saline 7 days earlier. A very small number of axons undergoing Wallerian degeneration are present (arrows; shown at higher magnification in the inset), probably resulting from the insertion of the injection pipette. The tissue otherwise is apparently normal. Scale bars: main image, 50 µm; inset, 20 µm.
Fig. 2
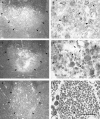
Light micrographs of the deep portion of the left dorsal column (margin indicated by arrowheads) 1 day (A), 3 days (B), and 5 days (D) after the injection of LPS into this region. Inflammatory cells are present, particularly surrounding blood vessels in the grey matter immediately adjacent to the dorsal funiculus. One such blood vessel, outlined by the box in B, is shown at higher magnification in C. Both mononuclear cells and PMNs can be seen in the wall of this vessel. Little or no demyelination, is present at 5 days (D), and this can be seen more clearly in the inset, which shows the region within the box at higher magnification. Scale bar (shown in D) = 100 µm in A, B and D (main image), 20 µm in C, 50 µm in inset.
Fig. 3
Electron micrographs of the dorsal columns during the first week following LPS injection. (A) A region of the dorsal funiculus 3 days after the injection of LPS. Although for the large majority of axons, myelin is not grossly disrupted at this time, very small numbers of demyelinated axons (arrows in inset) are present. The lack of myelin debris in the extracellular space surrounding these demyelinated axons suggests that the demyelination occurred soon after the injection. The morphology was similar 5 days after LPS injection (B), with the myelin sheaths of most fibres grossly normal but with small regions of cleanly demyelinated axons also present (e.g. arrows in inset). However, 7 days after injection (C, D and E), sheaths exhibiting enlarged adaxonal compartments containing various amounts of lamellar debris were common. Scale bar (shown in E) = 5 µm in A (inset = 10 µm), 25 µm in B (inset = 10 µm), 2 µm in C and D, and 3.6 µm in E.
Fig. 4
Light micrographs of dorsal funiculi 7 days (A and B), 14 days (C and D) and 28 days (E and F) after the injection of LPS. For each pair of micrographs, the image on the left shows the dorsal funiculus and adjacent grey matter at low magnification and the image on the right shows a region of the lesion at high magnification. In the low-magnification micrographs (A, C and E) the margins of the dorsal funiculus are outlined (arrowheads). At 7 days after injection, most of the deep dorsal funiculus, including all of the corticospinal tract, is undergoing demyelination. B shows a number of axons with disintegrating myelin (arrows), with the lamellae separating either at the adaxonal surface or in midsheath. Several debris-filled macrophages (e.g. arrowheads in B) are present. At 14 days after injection a similar region of lesion is present (C); however, in D it is apparent that the lesion now consists mainly of either apparently naked demyelinated axons (e.g. arrows) or demyelinated axons in the early stages of association with cells (e.g. arrowheads). A number of debris-filled phagocytes are obvious. At 28 days after injection a very large lesion is present, occupying nearly all of the dorsal funiculus. At this time, axons with the signet ring appearance characteristic of Schwann cell remyelination predominate (arrows in F). Scale bar (shown in F) = 300 µm in A, C and E, and 30 µm in B, D and F.
Fig. 5
Light micrographs illustrating the extent of Wallerian degeneration occurring within the dorsal funiculus 7 days after the injection of LPS. A shows the region of maximal Wallerian degeneration (e.g. arrows and arrowheads) in the non-corticospinal tract fibres approximately 4 mm rostral to the lesion. The degenerating axons indicated by the arrows in A are shown at higher magnification in the inset. The corticospinal tract approximately 4 mm caudal to the lesion is shown in B, which illustrates that relatively few fibres (arrows and arrowheads) are undergoing degeneration in this region. The degenerating axons indicated by the arrows in B are shown at higher magnification in the inset. Scale bar (shown in B) = 50 µm in the main images, 25 µm in the inset in A and 20 µm in the inset in B.
Fig. 6
Examples of immunohistochemical labelling of macrophages, T lymphocytes and ICAM-1 in the spinal cord. Large numbers of ED1-positive macrophages are present at the site of an injection of LPS 7 days earlier (A). The number of OX 52-positive T lymphocytes is smaller at this time (B), but represents the maximal number of T lymphocytes observed within the dorsal funiculus at any time point examined (Table 1). Up-regulation of ICAM-1 on blood vessels is evident at the site of LPS injection within the dorsal funiculus 4 h after injection (C), compared with the very light labelling present in the dorsal funiculus of the same animal 2.5 cm rostral to the site of injection (D). The intensity of blood vessel labelling in naive spinal cord is similar to that shown in D (data not shown). Scale bar (shown in D) = 30 µm.
Fig. 7
Light micrographs showing GFAP immunoreactivity at the interface between the dorsal funiculus (DF) and the grey matter (GM) in an animal 7 days after the injection of LPS into the spinal cord. A transverse section 2 cm rostral to the injection site is shown in A, and a similar region at the site of LPS injection is shown in B. Note the fine labelling of astrocyte processes present at the site distant from the lesion in both the dorsal funiculus (arrows in A) and grey matter (arrowheads in A). Labelling of astrocytes is increased at the injection site, with thickened astrocyte processes in both the dorsal funiculus (arrows in B) and the grey matter (arrowheads in B), and an overall increase in labelling density in the grey matter. Scale bar = 50 µm.
Fig. 8
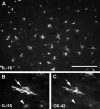
Epifluorescence photomicrographs of spinal cords 8 h after LPS injection. A shows a relatively low magnification image of a region of the dorsal funiculus labelled with an antibody against IL-1β. This proinflammatory cytokine is present in a large number of cells, most of which have multiple cell processes. The double-labelled section shown in B and C illustrates that many ramified cells at this time are positive for both IL-1β (arrow in B, visualized with fluorescein isothiocyanate) and OX-42 (arrow in C, visualized with rhodamine), a marker associated with quiescent microglia. Notice, however, that IL-1β-positive cells with a rounded morphology typically do not label with OX-42 (arrowheads in B and C), and are probably macrophages. Scale bar (shown in A) = 140 µm in A and 50 µm in B and C.
Fig. 9
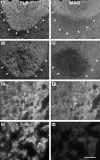
Epifluorescence micrographs of transverse sections through the spinal cord at the site of an LPS injection 5 (A and B) or 7 days (C–H) earlier. Sections were double-labelled for PLP (left column; rhodamine-conjugated secondary antibody) and MAG (right column; fluorescein isothiocyanate-conjugated secondary antibody) and pairs of photographs taken using appropriate filters. At low magnification (A–D) the entire lower portion of the dorsal funiculus (outlined by arrowheads) can be seen. Five days after injection, the dorsal funiculus exhibits relatively uniform PLP labelling (A); however, nearly the entire lower half of the dorsal funiculus shows reduced MAG immunoreactivity (B). Seven days after injection, PLP immunoreactivity is again present in the entire dorsal funiculus (C); however, there is a substantial area deep in the dorsal funiculus that exhibits only very little MAG labelling (D). A portion of the non-lesioned, superficial dorsal columns from this section is shown at high magnification in E and F, and the myelin sheaths appear as labelled rings with both antibodies. In a similar image taken deep in the dorsal funiculus, PLP immunoreactivity remains evident (G); however, MAG immunoreactivity (H) is nearly absent. Scale bar (shown in H) = 200 µm in A–D and 20 µm in E–H.
Fig. 10
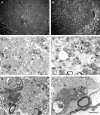
Lesions in the dorsal funiculus of animals treated with daily intraperitoneal injections of either dexamethasone (1.5 mg/kg; A, C and E) or saline (B, D and F) beginning 2 days before the injection of LPS. In A and B, epifluorescence micrographs illustrate the number of iNOS-positive cells present at the site of an injection of LPS 1 day earlier. Dexamethasone treatment (A) significantly reduced the number of iNOS-positive cells compared with saline treatment (B; see text for statistical analysis). C–F show light and electron micrographs of lesions in dexamethasone-treated (C and E respectively) and saline-treated (D and F respectively) animals 14 days after LPS injection. Saline-treated animals exhibit a lesion similar to that of untreated animals, with nests of packed demyelinated axons (e.g. arrows in D and F) and cell-associated demyelinated axons (e.g. arrowheads in D). Relatively small amounts of extracellular myelin debris are present at this time (e.g. upper left corner in F). Dexamethasone treatment does not prevent the demyelination, but does prolong the presence of debris, and the axons appear surrounded by whorls of disaggregated myelin (e.g. arrows in C and E). Comparing D with C, it is clear that debris-filled macrophages (e.g. M in D) are more prominent in lesions from animals treated with saline than in those treated with dexamethasone. Scale bar (shown in F) = 135 µm in A and B, 20 µm in C and D, and 5 µm in E and F.
Fig. 11
Lesion produced by the injection of highly purified LPS into the dorsal funiculus 10 days earlier. (A) Low-magnification light micrograph of a transverse section of the spinal cord at the level of the injection. The boundary of the dorsal funiculus is delineated by arrowheads, and a lesion comprising most of the deep half of the dorsal funiculus can be seen. In B, the region bounded by the box in A is shown at higher magnification. This region contains both demyelinated axons (e.g. arrowheads) and axons surrounded by myelin with an enlarged region between the compact myelin and the axon, consistent with vesiculation of the innermost lamellae (e.g. arrows), as illustrated in Fig. 3D. Scale bar (shown in B) = 200 µm in A and 20 µm in B.
Similar articles
- Generation of oligodendroglial progenitors in acute inflammatory demyelinating lesions of the rat brain stem is associated with demyelination rather than inflammation.
Di Bello IC, Dawson MR, Levine JM, Reynolds R. Di Bello IC, et al. J Neurocytol. 1999 Apr-May;28(4-5):365-81. doi: 10.1023/a:1007069815302. J Neurocytol. 1999. PMID: 10739577 - Lesion genesis in a subset of patients with multiple sclerosis: a role for innate immunity?
Marik C, Felts PA, Bauer J, Lassmann H, Smith KJ. Marik C, et al. Brain. 2007 Nov;130(Pt 11):2800-15. doi: 10.1093/brain/awm236. Brain. 2007. PMID: 17956913 Free PMC article. - Acute axonal injury in multiple sclerosis. Correlation with demyelination and inflammation.
Bitsch A, Schuchardt J, Bunkowski S, Kuhlmann T, Brück W. Bitsch A, et al. Brain. 2000 Jun;123 ( Pt 6):1174-83. doi: 10.1093/brain/123.6.1174. Brain. 2000. PMID: 10825356 - Behind the pathology of macrophage-associated demyelination in inflammatory neuropathies: demyelinating Schwann cells.
Park HT, Kim YH, Lee KE, Kim JK. Park HT, et al. Cell Mol Life Sci. 2020 Jul;77(13):2497-2506. doi: 10.1007/s00018-019-03431-8. Epub 2019 Dec 28. Cell Mol Life Sci. 2020. PMID: 31884566 Free PMC article. Review. - Epilepsy and demyelination: Towards a bidirectional relationship.
Li J, Qi H, Chen Y, Zhu X. Li J, et al. Prog Neurobiol. 2024 Mar;234:102588. doi: 10.1016/j.pneurobio.2024.102588. Epub 2024 Feb 18. Prog Neurobiol. 2024. PMID: 38378072 Review.
Cited by
- The radial diffusivity and magnetization transfer pool size ratio are sensitive markers for demyelination in a rat model of type III multiple sclerosis (MS) lesions.
Janve VA, Zu Z, Yao SY, Li K, Zhang FL, Wilson KJ, Ou X, Does MD, Subramaniam S, Gochberg DF. Janve VA, et al. Neuroimage. 2013 Jul 1;74:298-305. doi: 10.1016/j.neuroimage.2013.02.034. Epub 2013 Feb 26. Neuroimage. 2013. PMID: 23481461 Free PMC article. - An efficient and reproducible method for quantifying macrophages in different experimental models of central nervous system pathology.
Donnelly DJ, Gensel JC, Ankeny DP, van Rooijen N, Popovich PG. Donnelly DJ, et al. J Neurosci Methods. 2009 Jun 30;181(1):36-44. doi: 10.1016/j.jneumeth.2009.04.010. Epub 2009 Apr 23. J Neurosci Methods. 2009. PMID: 19393692 Free PMC article. - Possible involvement of TLRs and hemichannels in stress-induced CNS dysfunction via mastocytes, and glia activation.
Aguirre A, Maturana CJ, Harcha PA, Sáez JC. Aguirre A, et al. Mediators Inflamm. 2013;2013:893521. doi: 10.1155/2013/893521. Epub 2013 Jul 2. Mediators Inflamm. 2013. PMID: 23935250 Free PMC article. Review. - Involvement of CLEC16A in activation of astrocytes after LPS treated.
Wu X, Li J, Chen C, Yan Y, Jiang S, Wu X, Shao B, Xu J, Kang L, Huang Y, Zhu L, Ji Y, Gao Y. Wu X, et al. Neurochem Res. 2012 Jan;37(1):5-14. doi: 10.1007/s11064-011-0581-4. Epub 2011 Oct 15. Neurochem Res. 2012. PMID: 22002632 - Correlation between Antibodies to Bacterial Lipopolysaccharides and Barrier Proteins in Sera Positive for ASCA and ANCA.
Vojdani A, Vojdani E, Herbert M, Kharrazian D. Vojdani A, et al. Int J Mol Sci. 2020 Feb 18;21(4):1381. doi: 10.3390/ijms21041381. Int J Mol Sci. 2020. PMID: 32085663 Free PMC article.
References
- Aboul-Enein F, Rauschka H, Kornek B, Stadelmann C, Stefferl A, Brück W, et al. Preferential loss of myelin-associated glycoprotein reflects hypoxia-like white matter damage in stroke and inflammatory brain diseases. J Neuropathol Exp Neurol 2003; 62: 25–33. - PubMed
- Akira S, Takeda K. Toll-like receptor signalling. Nat Rev 2004; 4: 499–511. - PubMed
- Andersson P-B, Perry VH, Gordon S. The acute inflammatory response to lipopolysaccharide in CNS parenchyma differs from that in other body tissues. Neuroscience 1992; 48: 169–86. - PubMed
- Baudoin D, Gambarelli D, Gayraud D, Bensa P, Nicoli F, Sudan N, et al. Devic's neuromyelitis optica: a clinicopathological review of the literature in connection with a case showing fatal dysautonomia. Clin Neuropathol 1998; 17: 175–83. - PubMed
Publication types
MeSH terms
Substances
LinkOut - more resources
Full Text Sources
Other Literature Sources
Medical


