The organization of the core proteins of the yeast spindle pole body - PubMed (original) (raw)
The organization of the core proteins of the yeast spindle pole body
Eric G D Muller et al. Mol Biol Cell. 2005 Jul.
Abstract
The spindle pole body (SPB) is the microtubule organizing center of Saccharomyces cerevisiae. Its core includes the proteins Spc42, Spc110 (kendrin/pericentrin ortholog), calmodulin (Cmd1), Spc29, and Cnm67. Each was tagged with CFP and YFP and their proximity to each other was determined by fluorescence resonance energy transfer (FRET). FRET was measured by a new metric that accurately reflected the relative extent of energy transfer. The FRET values established the topology of the core proteins within the architecture of SPB. The N-termini of Spc42 and Spc29, and the C-termini of all the core proteins face the gap between the IL2 layer and the central plaque. Spc110 traverses the central plaque and Cnm67 spans the IL2 layer. Spc42 is a central component of the central plaque where its N-terminus is closely associated with the C-termini of Spc29, Cmd1, and Spc110. When the donor-acceptor pairs were ordered into five broad categories of increasing FRET, the ranking of the pairs specified a unique geometry for the positions of the core proteins, as shown by a mathematical proof. The geometry was integrated with prior cryoelectron tomography to create a model of the interwoven network of proteins within the central plaque. One prediction of the model, the dimerization of the calmodulin-binding domains of Spc110, was confirmed by in vitro analysis.
Figures
Figure 1.
Core layers of the SPB. (A) Schematic diagram of the SPB shows the proteins and the layers where they are located. The image is drawn approximately to scale for the dimensions of an SPB from a diploid cell. Scale bar, 25 nm. (B) Schematic of possible positions for CFP and YFP when attached to SPB components. For different CFP and YFP combinations the capacity for FRET is shown.
Figure 2.
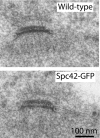
Electron micrographs of wild-type and Spc42-GFP–tagged SPBs show standard morphology.
Figure 3.
Evaluating FRET by fluorescence microscopy. Fluorescence occurs in the FRET channel even when only YFP or CFP are present and energy transfer cannot occur. The combination of the spillover from the YFP and CFP channels creates the baseline to evaluate actual energy transfer in the positive control. The filter set combinations are shown for each channel. The order of image acquisition is from left to right. For each strain, images were saved in the TIFF format with the same minimum and maximum pixel intensity.
Figure 4.
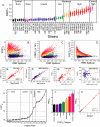
The measurement of FRET. (A) The different combinations of tagged core SPB proteins produced a full range of experimental FRETR values. Each point represents the FRETR value of an individual SPB. On average 80 SPBs were examined for each strain. The YFP/CFP combinations in each strain are described in Table 1. The means are connected. The color coding for the different categories is kept throughout the figure and in Figure 6, A, D, and E. (B–D) FRETR is independent of the extent of spillover in contrast to other FRET metrics. FRETR was compared with FRETS and FRETN. FRETS equals the FRETchannel – SpilloverTotal. FRETN equals FRETS ÷ (CFPchannel × YFPchannel) (Gordon et al., 1998). The same dataset of 3401 color-coded SPBs was used to compute FRETR FRETS, and FRETN. (B) In each category FRETR is independent of spillover as seen by the even response as spillover increased. (C and D) For FRETS and FRETN bias was apparent. As spillover increased FRETS increased and FRETN was suppressed. (E–H) FRETR response is linear. FRETR is equal to the slope of the lines in E and F. FRETN is equal to the slope of the lines in G and H. (I) Protein combinations were grouped into five FRETR categories. Plotted are the means and standard deviations. The numbers indicating the protein pairs correspond to the row numbers in Table 2. (J) The combined group means of the FRETR categories show clear differences. Bars correspond to the SD. Tukey-Kramer test classified the experimental categories statistically different at an alpha greater than 10–6. (K) The linear relationship between FRETR and NFRET. NFRET = FRETS÷ (CFPchannel × YFPchannel)1/2 (Xia and Liu, 2001). The mean FRET values for the protein pairs in I were calculated using both metrics from the same dataset of 3401 SPBs and also color coded as in I.
Figure 5.
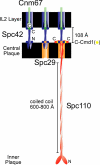
Schematic edge-on view of SPB core proteins showing the course of the proteins through the central plaque and IL2 layers. The distance and depth of the layers as seen in cryo-electronmicrographs are shown. The circles represent the termini, and the twists represent regions of coiled coils. Spc42 is shown in blue, Cnm67 in green, Spc29 in orange, Cmd1 in yellow, and Spc110 in red.
Figure 6.
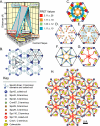
The spatial arrangement of the core proteins in the central plaque. (A) The relative postitions of the N- and C-termini as proven in Supplementary Materials. The geometry is presented in the context of the spacing between the IL2 layer and the central plaque. The lines connecting the termini follow the color coding of the FRET categories in Figure 4. (B) The lattice pattern of Spc42 in the IL2 layer based on the two-dimensional projection map of protein density described in (Bullitt et al., 1997). The repeat units of 3- and sixfold symmetry are shown. (C–E) Steps in the construction of the model of the central plaque. (C) Face-on view of the hexagonal unit of the central plaque shown from the perspective of the IL2 layer. Spc42 coiled coils projecting from the IL2 layer are at the vertices. The 30 Å lateral cross section of the fluorescent proteins are shown as circles. Orange, blue, yellow, and red represent the fluorescent proteins centered on C:Spc29, N:Spc42, C:Cmd1, and C:Spc110, respectively. The triangular arrangement of the proteins in the plane of the central plaque in A was introduced and sixfold rotational symmetry was applied. The proteins were closely packed to minimize the dimensions of the hexagonal unit. (D) Positions of termini. (E) Placement of N:Spc29. N:Spc29 and C:Spc29 are equidistant to C:Cmd1. N:Spc29 lies outside of the area, colored blue, where protein ends are close enough to C:Spc42 to register FRET. (F–H) Expanded schematic models of the central plaque that connect ends and includes features described in text and Materials and Methods. (F) Spc29 and Spc42; (G) Spc110 and Cmd1; and (I) all the components of the central plaque.
Similar articles
- Yeast pericentrin/Spc110 contains multiple domains required for tethering the γ-tubulin complex to the centrosome.
Alonso A, Fabritius A, Ozzello C, Andreas M, Klenchin D, Rayment I, Winey M. Alonso A, et al. Mol Biol Cell. 2020 Jul 1;31(14):1437-1452. doi: 10.1091/mbc.E20-02-0146. Epub 2020 May 6. Mol Biol Cell. 2020. PMID: 32374651 Free PMC article. - Analysis of a spindle pole body mutant reveals a defect in biorientation and illuminates spindle forces.
Yoder TJ, McElwain MA, Francis SE, Bagley J, Muller EG, Pak B, O'Toole ET, Winey M, Davis TN. Yoder TJ, et al. Mol Biol Cell. 2005 Jan;16(1):141-52. doi: 10.1091/mbc.e04-08-0703. Epub 2004 Nov 3. Mol Biol Cell. 2005. PMID: 15525672 Free PMC article. - A mutational analysis identifies three functional regions of the spindle pole component Spc110p in Saccharomyces cerevisiae.
Sundberg HA, Davis TN. Sundberg HA, et al. Mol Biol Cell. 1997 Dec;8(12):2575-90. doi: 10.1091/mbc.8.12.2575. Mol Biol Cell. 1997. PMID: 9398677 Free PMC article. - Lessons from yeast: the spindle pole body and the centrosome.
Kilmartin JV. Kilmartin JV. Philos Trans R Soc Lond B Biol Sci. 2014 Sep 5;369(1650):20130456. doi: 10.1098/rstb.2013.0456. Philos Trans R Soc Lond B Biol Sci. 2014. PMID: 25047610 Free PMC article. Review. - Composition of the spindle pole body of Saccharomyces cerevisiae and the proteins involved in its duplication.
Helfant AH. Helfant AH. Curr Genet. 2002 Feb;40(5):291-310. doi: 10.1007/s00294-001-0263-x. Epub 2001 Dec 8. Curr Genet. 2002. PMID: 11935220 Review.
Cited by
- Fission yeast Pcp1 links polo kinase-mediated mitotic entry to gamma-tubulin-dependent spindle formation.
Fong CS, Sato M, Toda T. Fong CS, et al. EMBO J. 2010 Jan 6;29(1):120-30. doi: 10.1038/emboj.2009.331. Epub 2009 Nov 26. EMBO J. 2010. PMID: 19942852 Free PMC article. - Kinetochore biorientation in Saccharomyces cerevisiae requires a tightly folded conformation of the Ndc80 complex.
Tien JF, Umbreit NT, Zelter A, Riffle M, Hoopmann MR, Johnson RS, Fonslow BR, Yates JR 3rd, MacCoss MJ, Moritz RL, Asbury CL, Davis TN. Tien JF, et al. Genetics. 2014 Dec;198(4):1483-93. doi: 10.1534/genetics.114.167775. Epub 2014 Sep 16. Genetics. 2014. PMID: 25230952 Free PMC article. - Analysis of ER resident proteins in Saccharomyces cerevisiae: implementation of H/KDEL retrieval sequences.
Young CL, Raden DL, Robinson AS. Young CL, et al. Traffic. 2013 Apr;14(4):365-81. doi: 10.1111/tra.12041. Epub 2013 Feb 4. Traffic. 2013. PMID: 23324027 Free PMC article. - Electron tomography reveals aspects of spindle structure important for mechanical stability at metaphase.
O'Toole E, Morphew M, McIntosh JR. O'Toole E, et al. Mol Biol Cell. 2020 Feb 1;31(3):184-195. doi: 10.1091/mbc.E19-07-0405. Epub 2019 Dec 11. Mol Biol Cell. 2020. PMID: 31825721 Free PMC article. - Structure and function of Spc42 coiled-coils in yeast centrosome assembly and duplication.
Drennan AC, Krishna S, Seeger MA, Andreas MP, Gardner JM, Sether EKR, Jaspersen SL, Rayment I. Drennan AC, et al. Mol Biol Cell. 2019 Jun 1;30(12):1505-1522. doi: 10.1091/mbc.E19-03-0167. Epub 2019 Apr 10. Mol Biol Cell. 2019. PMID: 30969903 Free PMC article.
References
- Babu, Y. S., Sack, J. S., Greenhough, T. J., Bugg, C. E., Means, A. R., and Cook, W. J. (1985). Three-dimensional structure of calmodulin. Nature 315, 37–40. - PubMed
- Blondel, A., and Bedouelle, H. (1990). Export and purification of a cytoplasmic dimeric protein by fusion to the maltose-binding protein of Escherichia coli. Eur. J. Biochem. 193, 325–330. - PubMed
Publication types
MeSH terms
Substances
Grants and funding
- R01 GM40506/GM/NIGMS NIH HHS/United States
- R01 GM040506/GM/NIGMS NIH HHS/United States
- P41 RR011823/RR/NCRR NIH HHS/United States
- P41 RR 11823/RR/NCRR NIH HHS/United States
- P41 RR000592/RR/NCRR NIH HHS/United States
- RR-00592/RR/NCRR NIH HHS/United States
LinkOut - more resources
Full Text Sources
Other Literature Sources
Molecular Biology Databases
Research Materials
Miscellaneous


