Systematic interpretation of genetic interactions using protein networks - PubMed (original) (raw)
Systematic interpretation of genetic interactions using protein networks
Ryan Kelley et al. Nat Biotechnol. 2005 May.
Abstract
Genetic interaction analysis,in which two mutations have a combined effect not exhibited by either mutation alone, is a powerful and widespread tool for establishing functional linkages between genes. In the yeast Saccharomyces cerevisiae, ongoing screens have generated >4,800 such genetic interaction data. We demonstrate that by combining these data with information on protein-protein, prote in-DNA or metabolic networks, it is possible to uncover physical mechanisms behind many of the observed genetic effects. Using a probabilistic model, we found that 1,922 genetic interactions are significantly associated with either between- or within-pathway explanations encoded in the physical networks, covering approximately 40% of known genetic interactions. These models predict new functions for 343 proteins and suggest that between-pathway explanations are better than within-pathway explanations at interpreting genetic interactions identified in systematic screens. This study provides a road map for how genetic and physical interactions can be integrated to reveal pathway organization and function.
Conflict of interest statement
COMPETING INTERESTS STATEMENT
The authors declare that they have no competing financial interests.
Figures
Figure 1
Method overview. A combined physical and genetic network is searched to identify between- or within-pathway models of genetic interactions. The between-pathway model implies two groups of proteins (pathways) with many physical connections within each pathway (solid blue links) and genetic interactions spanning between pathways (dotted red links). The within-pathway model implies many physical and genetic interactions within the same group of proteins. In the search, 360 and 91 network models were identified that correspond to between- or within-pathway searches, respectively.
Figure 2
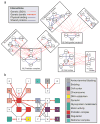
Between-pathway explanations for genetic interactions. (a) Several high-scoring models are shown (M,N,T; Q,V; O,U,Y). Blue solid and red dotted links indicate physical and genetic interactions, respectively. (b) Bird’s-eye view of all between-pathway models obtained from a search on a reduced network composed of SGA and DIP interactions. Each node [A]–[Z] represents a physical pathway; groups of genetic interactions between pathways are condensed into a single link called a ‘bundle.’ Node colors indicate significant Gene Ontology annotations. Solid gray lines connect pathways that share one or more proteins; such pathways may represent different components of a larger mechanism.
Figure 3
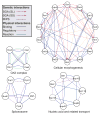
Within-pathway explanations for genetic interactions. A total of 91 pathways were identified, of which four examples are displayed. Color is used to indicate the data set from which each interaction was drawn.
Figure 4
Genetic interaction prediction schemes. Two different schemes are proposed for predicting genetic interactions, depending on the underlying network model. Observed genetic interactions are shown in red, while the corresponding predicted genetic interactions are shown in gray. (a) Under the between-pathway model, two incomplete bipartite motifs are shown which predict a genetic interaction between genes b and _b_′. (b) Under the within-pathway model, common genetic neighbors are used to predict a genetic interaction between genes d and _d_′. Note that these diagrams contain additional incomplete motifs which have been omitted for clarity: the motifs in a can be rearranged to predict genetic interactions (a to _c_′) and (c to _a_′); the motifs in b can be rearranged to predict (e to f).
Figure 5
Success rate of genetic interaction prediction versus the stringency of prediction. Success rate is measured through cross-validation as (predicted positives)/(predicted positives and negatives). Stringency is defined by the minimum number of incomplete bipartite motifs required for prediction. Blue diamonds mark the success rate for predictions in which incomplete motifs must occur in a between-pathway model. The success rate is dramatically higher than for naive predictions (magenta) which predict interactions in the same manner, but are not constrained by the physical network. Even for much more stringent prediction criteria, the success rate of naive predictions fails to exceed that of the between-pathway predictions (inset).
Similar articles
- Estimating gene regulatory networks and protein-protein interactions of Saccharomyces cerevisiae from multiple genome-wide data.
Nariai N, Tamada Y, Imoto S, Miyano S. Nariai N, et al. Bioinformatics. 2005 Sep 1;21 Suppl 2:ii206-12. doi: 10.1093/bioinformatics/bti1133. Bioinformatics. 2005. PMID: 16204105 - Discovering molecular pathways from protein interaction and gene expression data.
Segal E, Wang H, Koller D. Segal E, et al. Bioinformatics. 2003;19 Suppl 1:i264-71. doi: 10.1093/bioinformatics/btg1037. Bioinformatics. 2003. PMID: 12855469 - Functional clustering of yeast proteins from the protein-protein interaction network.
Sen TZ, Kloczkowski A, Jernigan RL. Sen TZ, et al. BMC Bioinformatics. 2006 Jul 24;7:355. doi: 10.1186/1471-2105-7-355. BMC Bioinformatics. 2006. PMID: 16863590 Free PMC article. - Inferring network interactions within a cell.
Carter GW. Carter GW. Brief Bioinform. 2005 Dec;6(4):380-9. doi: 10.1093/bib/6.4.380. Brief Bioinform. 2005. PMID: 16420736 Review. - Exploring genetic interactions and networks with yeast.
Boone C, Bussey H, Andrews BJ. Boone C, et al. Nat Rev Genet. 2007 Jun;8(6):437-49. doi: 10.1038/nrg2085. Nat Rev Genet. 2007. PMID: 17510664 Review.
Cited by
- Glutathione S-Transferase (GSTT1 rs17856199) and Nitric Oxide Synthase (NOS2 rs2297518) Genotype Combination as Potential Oxidative Stress-Related Molecular Markers for Type 2 Diabetes Mellitus.
Gusti AMT, Qusti SY, Bahijri SM, Toraih EA, Bokhari S, Attallah SM, Alzahrani A, Alshehri WMA, Alotaibi H, Fawzy MS. Gusti AMT, et al. Diabetes Metab Syndr Obes. 2021 Mar 25;14:1385-1403. doi: 10.2147/DMSO.S300525. eCollection 2021. Diabetes Metab Syndr Obes. 2021. PMID: 33790606 Free PMC article. - eQTL Epistasis - Challenges and Computational Approaches.
Huang Y, Wuchty S, Przytycka TM. Huang Y, et al. Front Genet. 2013 May 31;4:51. doi: 10.3389/fgene.2013.00051. eCollection 2013. Front Genet. 2013. PMID: 23755066 Free PMC article. - Differential genetic interactions of yeast stress response MAPK pathways.
Martin H, Shales M, Fernandez-Piñar P, Wei P, Molina M, Fiedler D, Shokat KM, Beltrao P, Lim W, Krogan NJ. Martin H, et al. Mol Syst Biol. 2015 Apr 17;11(4):800. doi: 10.15252/msb.20145606. Mol Syst Biol. 2015. PMID: 25888283 Free PMC article. - Dissection of DNA damage responses using multiconditional genetic interaction maps.
Guénolé A, Srivas R, Vreeken K, Wang ZZ, Wang S, Krogan NJ, Ideker T, van Attikum H. Guénolé A, et al. Mol Cell. 2013 Jan 24;49(2):346-58. doi: 10.1016/j.molcel.2012.11.023. Epub 2012 Dec 27. Mol Cell. 2013. PMID: 23273983 Free PMC article. - A global analysis of genetic interactions in Caenorhabditis elegans.
Byrne AB, Weirauch MT, Wong V, Koeva M, Dixon SJ, Stuart JM, Roy PJ. Byrne AB, et al. J Biol. 2007;6(3):8. doi: 10.1186/jbiol58. Epub 2007 Sep 26. J Biol. 2007. PMID: 17897480 Free PMC article.
References
- Guarente L. Synthetic enhancement in gene interaction: a genetic tool come of age. Trends Genet. 1993;9:362–366. - PubMed
- Thomas JH. Thinking about genetic redundancy. Trends Genet. 1993;9:395–399. - PubMed
- Hartman JL, Garvik B, Hartwell L. Principles for the buffering of genetic variation. Science. 2001;291:1001–1004. - PubMed
- Sham P. Shifting paradigms in gene-mapping methodology for complex traits. Pharmacogenomics. 2001;2:195–202. - PubMed
Publication types
MeSH terms
Substances
Grants and funding
- R01 GM070743/GM/NIGMS NIH HHS/United States
- R01 GM070743-01/GM/NIGMS NIH HHS/United States
- R01 GM070743-02/GM/NIGMS NIH HHS/United States
- GM070743-01/GM/NIGMS NIH HHS/United States
LinkOut - more resources
Full Text Sources
Other Literature Sources
Molecular Biology Databases


