The domains of a cholesterol-dependent cytolysin undergo a major FRET-detected rearrangement during pore formation - PubMed (original) (raw)
Comparative Study
. 2005 May 17;102(20):7139-44.
doi: 10.1073/pnas.0500556102. Epub 2005 May 6.
Affiliations
- PMID: 15878993
- PMCID: PMC1129106
- DOI: 10.1073/pnas.0500556102
Comparative Study
The domains of a cholesterol-dependent cytolysin undergo a major FRET-detected rearrangement during pore formation
Rajesh Ramachandran et al. Proc Natl Acad Sci U S A. 2005.
Abstract
FRET measurements were used to determine the domain-specific topography of perfringolysin O, a pore-forming toxin, on a membrane surface at different stages of pore formation. The data reveal that the elongated toxin monomer binds stably to the membrane in an "end-on" orientation, with its long axis approximately perpendicular to the plane of the membrane bilayer. This orientation is largely retained even after monomer association to form an oligomeric prepore complex. The domain 3 (D3) polypeptide segments that ultimately form transmembrane beta-hairpins remain far above the membrane surface in both the membrane-bound monomer and prepore oligomer. Upon pore formation, these segments enter the bilayer, whereas D1 moves to a position that is substantially closer to the membrane. Therefore, the extended D2 beta-structure that connects D1 to membrane-bound D4 appears to bend or otherwise reconfigure during the prepore-to-pore transition of the perfringolysin O oligomer.
Figures
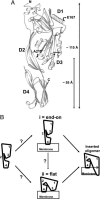
Fig. 1.
PFO domains and possible rearrangements. (A) Ribbon representation of the crystal structure of monomeric water-soluble PFO (5) shows locations of E167 in D1 and A215 in D3 that were substituted with Cys and labeled with BODIPY. A cross-bar indicates locations of the two residues that formed an intramolecular disulfide bond after substitution by Cys; a star indicates the location of the F318A mutation. The image was generated by using
molscript
. (B) Cartoons of potential domain rearrangements as PFO first binds to the membrane and then oligomerizes before forming the inserted pore complex.
Fig. 2.
Spectral overlap. The corrected emission spectrum of 6 nM rPFODS(A215C-BODIPY) (solid line) and the absorbance spectrum of Rh-PE (2 mol percentage) (dotted line) in cholesterol-containing vesicles (0.5 mM total lipid) are shown.
Fig. 3.
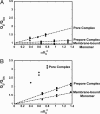
Dependence of energy transfer upon acceptor density. _Q_D/_Q_DA values for BODIPY-labeled D1 (A) or D3 (B) at different stages of pore formation and at three different acceptor densities. Best-fit lines were required to go through 0, 1. No line is shown for the pore complex data in B because L ≪ _R_0 and Eq. 1 does not apply.
Fig. 4.
FRET-detected changes in PFO topography. Based on domain-specific FRET measurements, the orientation of membrane-bound PFO at different stages before membrane insertion is shown and described in the text. For simplicity, only one monomer in the prepore (iii) and pore (iv) complexes is shown.
Similar articles
- Vertical collapse of a cytolysin prepore moves its transmembrane beta-hairpins to the membrane.
Czajkowsky DM, Hotze EM, Shao Z, Tweten RK. Czajkowsky DM, et al. EMBO J. 2004 Aug 18;23(16):3206-15. doi: 10.1038/sj.emboj.7600350. Epub 2004 Aug 5. EMBO J. 2004. PMID: 15297878 Free PMC article. - Structural insights into the membrane-anchoring mechanism of a cholesterol-dependent cytolysin.
Ramachandran R, Heuck AP, Tweten RK, Johnson AE. Ramachandran R, et al. Nat Struct Biol. 2002 Nov;9(11):823-7. doi: 10.1038/nsb855. Nat Struct Biol. 2002. PMID: 12368903 - The mechanism of pore assembly for a cholesterol-dependent cytolysin: formation of a large prepore complex precedes the insertion of the transmembrane beta-hairpins.
Shepard LA, Shatursky O, Johnson AE, Tweten RK. Shepard LA, et al. Biochemistry. 2000 Aug 22;39(33):10284-93. doi: 10.1021/bi000436r. Biochemistry. 2000. PMID: 10956018 - The cholesterol-dependent cytolysins.
Tweten RK, Parker MW, Johnson AE. Tweten RK, et al. Curr Top Microbiol Immunol. 2001;257:15-33. doi: 10.1007/978-3-642-56508-3_2. Curr Top Microbiol Immunol. 2001. PMID: 11417120 Review. - The cholesterol-dependent cytolysin family of gram-positive bacterial toxins.
Heuck AP, Moe PC, Johnson BB. Heuck AP, et al. Subcell Biochem. 2010;51:551-77. doi: 10.1007/978-90-481-8622-8_20. Subcell Biochem. 2010. PMID: 20213558 Review.
Cited by
- Revealing the topography of cellular membrane domains by combined atomic force microscopy/fluorescence imaging.
Frankel DJ, Pfeiffer JR, Surviladze Z, Johnson AE, Oliver JM, Wilson BS, Burns AR. Frankel DJ, et al. Biophys J. 2006 Apr 1;90(7):2404-13. doi: 10.1529/biophysj.105.073692. Epub 2006 Jan 13. Biophys J. 2006. PMID: 16415053 Free PMC article. - Conformational changes during pore formation by the perforin-related protein pleurotolysin.
Lukoyanova N, Kondos SC, Farabella I, Law RH, Reboul CF, Caradoc-Davies TT, Spicer BA, Kleifeld O, Traore DA, Ekkel SM, Voskoboinik I, Trapani JA, Hatfaludi T, Oliver K, Hotze EM, Tweten RK, Whisstock JC, Topf M, Saibil HR, Dunstone MA. Lukoyanova N, et al. PLoS Biol. 2015 Feb 5;13(2):e1002049. doi: 10.1371/journal.pbio.1002049. eCollection 2015 Feb. PLoS Biol. 2015. PMID: 25654333 Free PMC article. - Obstructing toxin pathways by targeted pore blockage.
Nestorovich EM, Bezrukov SM. Nestorovich EM, et al. Chem Rev. 2012 Dec 12;112(12):6388-430. doi: 10.1021/cr300141q. Epub 2012 Oct 11. Chem Rev. 2012. PMID: 23057504 Free PMC article. Review. No abstract available. - An Intermolecular π-Stacking Interaction Drives Conformational Changes Necessary to β-Barrel Formation in a Pore-Forming Toxin.
Burns JR, Morton CJ, Parker MW, Tweten RK. Burns JR, et al. mBio. 2019 Jul 2;10(4):e01017-19. doi: 10.1128/mBio.01017-19. mBio. 2019. PMID: 31266869 Free PMC article. - A new model for pore formation by cholesterol-dependent cytolysins.
Reboul CF, Whisstock JC, Dunstone MA. Reboul CF, et al. PLoS Comput Biol. 2014 Aug 21;10(8):e1003791. doi: 10.1371/journal.pcbi.1003791. eCollection 2014 Aug. PLoS Comput Biol. 2014. PMID: 25144725 Free PMC article.
References
- Olofsson, A., Hebert, H. & Thelestam, M. (1993) FEBS Lett. 319, 125-127. - PubMed
- Alouf, J. E. (1999) in The Comprehensive Sourcebook of Bacterial Protein Toxins, eds. Alouf, J. E. & Freer, J. H. (Academic, London), pp. 443-456.
- Heuck, A. P., Tweten, R. K. & Johnson, A. E. (2001) Biochemistry 40, 9065-9073. - PubMed
- Tweten, R. K., Parker, M. W. & Johnson, A. E. (2001) Curr. Top. Microbiol. Immunol. 257, 15-33. - PubMed
- Rossjohn, J., Feil, S. C., Mckinstry, W. J., Tweten, R. K. & Parker, M. W. (1997) Cell 89, 685-692. - PubMed
Publication types
MeSH terms
Substances
LinkOut - more resources
Full Text Sources
Other Literature Sources


