Temporal and spatial distribution of ciliogenesis in the tracheobronchial airways of mice - PubMed (original) (raw)
Temporal and spatial distribution of ciliogenesis in the tracheobronchial airways of mice
Elina Toskala et al. Am J Physiol Lung Cell Mol Physiol. 2005 Sep.
Abstract
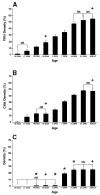
Little is known about ciliogenesis as it proceeds through the entire airway tree, from the trachea to the terminal bronchioles, especially during the postnatal period. The purpose of this study was to define the spatial and temporal (prenatal and postnatal) pattern of normal cilia development in the mouse. Three airway generations representing the entire airway tree were examined: trachea, lobar bronchi, and terminal bronchiole. Ciliated cells in lung lobe whole mounts were labeled with a fluorescent dye for confocal microscopy, and ciliated cell surface density was measured for each airway generation and age. The same samples were examined by scanning electron microscopy to verify the appearance of ciliated cells among the differentiating epithelium of the airways. Ciliated cells were first detected in the trachea and lobar bronchi at 16 days gestational age (DGA) and in the terminal bronchioles at 18 DGA. Ciliated cell surface density increased with prenatal and postnatal age at all airway levels. However, the ciliated cell surface density of the trachea and lobar bronchi was always greater compared with the terminal bronchiole. In conclusion, the study revealed that in developing tracheobronchial airways of the mouse: 1) Ciliogenesis differs temporally and spatially by airway generation; 2) Ciliated cell surface density increases with age in all airway generations, but density decreases in a proximal to distal direction; and 3) A significant portion of ciliogenesis continues after birth. This study provides a healthy basis for investigations of neonatal pulmonary disease or pollutant toxicity affecting cilia and its functions.
Figures
Figure 1
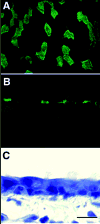
Microscopic images of adult mouse trachea labeled with FITC conjugated tomato lectin taken with (A) scanning confocal microscope (B) epifluorescence (C) transmitted light. Ciliated areas shown with epifluorescence are the same areas observed with transmitted light. Bar = 10 micrometers.
Figure 2
Comparison of age-related ciliated cell surface density in three airways of mouse lung: (A) trachea (B) lobar bronchi (C) terminal bronchioles. Time points include 16, 17, 18, and 19 days gestation (DGA); 1, 7, 14, and 21 days postnatal (DPN); and adult. Ciliated cell surface density is expressed as percentage of airway surface area. NS = No significant differences within each airway level between time points in brackets. Otherwise, the significance within each airway level between time points is p < 0.05. * = significantly different (p < 0.05) from the trachea and lobar bronchi at the same time point. + = significantly different (p < 0.05) from the other two airway generations at the same time point.
Figure 3
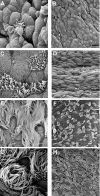
SEM images of the development of cilia in the trachea of mice at different ages: 16 DGA (A, B), 19 DGA (C, D), 14 DPN (E, F), and 21 DPN (G, H). At 16 DGA, sparse, single ciliated cells were visible. The remaining cells were undifferentiated and round, lacking microvilli or apical projections. At 19 DGA, cilia were short and covered the surface of ciliated cells. Cilia cells appeared alone or in pairs. Nonciliated cells were flat and had some microvilli. At 14 DPN, ciliated cells were covered by long cilia and occurred in pairs or in rows of 3–4 cells. At 21 DPN, ciliated cells have long cilia. Bar = 10 micrometers in A, C, E, and G. Bar = 50 micrometers in B, D, F, and H.
Figure 4
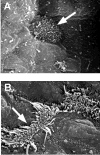
SEM images of the development of cilia in the terminal bronchiole. (A) Ciliated cells were first seen at 18 DGA and were single, fairly flat cells with very short cilia and microvilli. Nonciliated cells surrounding the ciliated cells were undifferentiated and slightly raised. (B) At 14 DPN, ciliated cells had long cilia and were alone or in pairs. Bar = 10 micrometers in A and B. Arrows indicate cilated cells.
Figure 5
SEM images of (A) trachea (B) lobar bronchi and (C) terminal bronchiole in adult mice. Cilia are long and cover the entire surface of the cell and extend over the cell margins in the trachea and lobar bronchi. Ciliated cells appeared in rows of 4–6 cells. In the terminal bronchioles, cilia are shorter and cells appear in single or in pairs. Bar = 10 micrometers.
Similar articles
- Patterns of cilia formation in the lower respiratory tract of the dog: a scanning electron microscopic study.
Wright NG, Brown RM, McCandlish IA, Thompson H, Cornwell HJ. Wright NG, et al. Res Vet Sci. 1983 May;34(3):340-6. Res Vet Sci. 1983. PMID: 6878887 - Tracheobronchial epithelium in the adult rhesus monkey: a quantitative histochemical and ultrastructural study.
Plopper CG, Heidsiek JG, Weir AJ, George JA, Hyde DM. Plopper CG, et al. Am J Anat. 1989 Jan;184(1):31-40. doi: 10.1002/aja.1001840104. Am J Anat. 1989. PMID: 2916437 - The respiratory epithelium. II. Hamster trachea, bronchus, and bronchioles.
Becci PJ, McDowell EM, Trump BF. Becci PJ, et al. J Natl Cancer Inst. 1978 Aug;61(2):551-61. J Natl Cancer Inst. 1978. PMID: 355650 Review. - [Structure and function of the cilia epithelium of the respiratory tract].
Tarchalski J. Tarchalski J. Pneumonol Pol. 1981;49(5):383-90. Pneumonol Pol. 1981. PMID: 7022386 Review. Polish. No abstract available.
Cited by
- Ciliary beat frequency is maintained at a maximal rate in the small airways of mouse lung slices.
Delmotte P, Sanderson MJ. Delmotte P, et al. Am J Respir Cell Mol Biol. 2006 Jul;35(1):110-7. doi: 10.1165/rcmb.2005-0417OC. Epub 2006 Feb 16. Am J Respir Cell Mol Biol. 2006. PMID: 16484686 Free PMC article. - A transgenic FOXJ1-Cre system for gene inactivation in ciliated epithelial cells.
Zhang Y, Huang G, Shornick LP, Roswit WT, Shipley JM, Brody SL, Holtzman MJ. Zhang Y, et al. Am J Respir Cell Mol Biol. 2007 May;36(5):515-9. doi: 10.1165/rcmb.2006-0475RC. Epub 2007 Jan 25. Am J Respir Cell Mol Biol. 2007. PMID: 17255554 Free PMC article. - Proceedings of the 2014 National Toxicology Program Satellite Symposium.
Elmore SA, Cora MC, Gruebbel MM, Hayes SA, Hoane JS, Koizumi H, Peters R, Rosol TJ, Singh BP, Szabo KA. Elmore SA, et al. Toxicol Pathol. 2015 Jan;43(1):10-40. doi: 10.1177/0192623314555526. Epub 2014 Nov 9. Toxicol Pathol. 2015. PMID: 25385331 Free PMC article. - HEATR2 plays a conserved role in assembly of the ciliary motile apparatus.
Diggle CP, Moore DJ, Mali G, zur Lage P, Ait-Lounis A, Schmidts M, Shoemark A, Garcia Munoz A, Halachev MR, Gautier P, Yeyati PL, Bonthron DT, Carr IM, Hayward B, Markham AF, Hope JE, von Kriegsheim A, Mitchison HM, Jackson IJ, Durand B, Reith W, Sheridan E, Jarman AP, Mill P. Diggle CP, et al. PLoS Genet. 2014 Sep 18;10(9):e1004577. doi: 10.1371/journal.pgen.1004577. eCollection 2014 Sep. PLoS Genet. 2014. PMID: 25232951 Free PMC article. - Molecular characterization of centriole assembly in ciliated epithelial cells.
Vladar EK, Stearns T. Vladar EK, et al. J Cell Biol. 2007 Jul 2;178(1):31-42. doi: 10.1083/jcb.200703064. J Cell Biol. 2007. PMID: 17606865 Free PMC article.
References
- Bankston PW, Porter GA, Milici AJ, Palade GE. Differential and specific labeling of epithelial and vascular endothelial cells of the rat lung by Lycopersicon esculentum and Griffonia simplicifolia I lectins. Eur J Cell Biol. 1991;54:187–195. - PubMed
- Blatt EN, Yan XH, Wuerffel MK, Hamilos DL, Brody SL. Forkhead transcription factor HFH-4 expression is temporally related to ciliogenesis. Am J Respir Cell Mol Biol. 1999;21:168–176. - PubMed
- Camner P, Mossberg B, Philipson K. Tracheobronchial clearance and chronic obstructive lung disease. Scand J Respir Dis. 1973;54:272–281. - PubMed
- Ferguson JL, McCaffrey TV, Kern EB, Martin WJ., 2nd The effects of sinus bacteria on human ciliated nasal epithelium in vitro. Otolaryngol Head Neck Surg. 1988;98:299–304. - PubMed
Publication types
MeSH terms
Substances
Grants and funding
- F32 ES005707/ES/NIEHS NIH HHS/United States
- ES-06700/ES/NIEHS NIH HHS/United States
- ES-00628/ES/NIEHS NIH HHS/United States
- P01 ES000628-249001/ES/NIEHS NIH HHS/United States
- R01 ES006700/ES/NIEHS NIH HHS/United States
- P30 ES005707-069011/ES/NIEHS NIH HHS/United States
- P30 ES005707/ES/NIEHS NIH HHS/United States
- R01 ES006700-11/ES/NIEHS NIH HHS/United States
- ES-05707/ES/NIEHS NIH HHS/United States
- P01 ES000628/ES/NIEHS NIH HHS/United States
LinkOut - more resources
Full Text Sources


