The neurosteroid allopregnanolone promotes proliferation of rodent and human neural progenitor cells and regulates cell-cycle gene and protein expression - PubMed (original) (raw)
Comparative Study
The neurosteroid allopregnanolone promotes proliferation of rodent and human neural progenitor cells and regulates cell-cycle gene and protein expression
Jun Ming Wang et al. J Neurosci. 2005.
Abstract
Our previous research demonstrated that the neuroactive progesterone metabolite allopregnanolone (3alpha-hydroxy-5alpha-pregnan-20-one) rapidly induced hippocampal neuron neurite regression (Brinton, 1994). We hypothesized that allopregnanolone-induced neurite regression was a prelude to mitogenesis initiated by a rise in intracellular calcium. Supporting this hypothesis, the current data demonstrate that allopregnanolone, in a dose-dependent manner, induces a significant increase in proliferation of neuroprogenitor cells (NPCs) derived from the rat hippocampus and human neural stem cells (hNSCs) derived from the cerebral cortex. Proliferation was determined by incorporation of bromodeoxyuridine and [3H]thymidine, fluorescence-activated cell sorter analysis of murine leukemia virus-green fluorescent protein-labeled mitotic NPCs, and total cell number counting. Allopregnanolone-induced proliferation was isomer and steroid specific, in that the stereoisomer 3beta-hydroxy-5beta-pregnan-20-one and related steroids did not increase [3H]thymidine uptake. Immunofluorescent analyses for the NPC markers nestin and Tuj1 indicated that newly formed cells were of neuronal lineage. Furthermore, microarray analysis of cell-cycle genes and real-time reverse transcription-PCR and Western blot validation revealed that allopregnanolone increased the expression of genes that promote mitosis and inhibited the expression of genes that repress cell proliferation. Allopregnanolone-induced proliferation was antagonized by the voltage-gated L-type calcium channel (VGLCC) blocker nifedipine, consistent with the finding that allopregnanolone induces a rapid increase in intracellular calcium in hippocampal neurons via a GABA type A receptor-activated VGLCC (Son et al., 2002). These data demonstrate that allopregnanolone significantly increased rat NPC and hNSC proliferation with concomitant regulation in mitotic cell-cycle genes via a VGLCC mechanism. The therapeutic potential of allopregnanolone as a neurogenic molecule is discussed.
Figures
Figure 1.
Characterization of neural progenitor cells in primary cultures of embryonic day 18 rat hippocampus. A, At 1 DIV, nestin (top)-positive cells are clustered, and nestin immunoreactivity is apparent within the cytoplasmic compartment of both the cell body and neurites. Nonclustered cells are nestin negative. The middle shows that the majority of cells are Tuj1 positive. The bottom shows one cell with BrdU immunoreactivity (green) localized to the nuclear compartment. Scale bars, 20 μm. B, At 1 DIV, a proportion of cells show coexpression of nestin (green) and MAP2 (red), as evidenced by yellow fluorescence. The majority of cells are MAP2 positive. At 4 DIV, the majority of cells label positive for MAP2, whereas immunolabeling for nestin, GFAP, and MBP is rarely observed. These data are consistent with the previous demonstration that the majority (>99%) of cells, under these culture conditions, are phenotypically neuronal (Brewer et al., 1993; Brewer, 1995). Scale bars, 20 μm.
Figure 2.
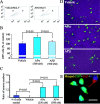
APα increases the nestin- and BrdU-positive cell numbers. A, BrdU incorporation was visualized by specific BrdU antibody immunofluorescence. Photomicrographic images are representative of control (top) and 500 n
m
APα-treated (bottom) rat E18 hippocampal cultures after 1 DIV APα exposure. Scale bars, 20 μm. B, Bar graph depicts quantitation of BrdU-positive cells from 10 randomly selected fields per slide. Total number of cells analyzed per slide was 800-1000. Three slides per condition were analyzed, for a total of 8964 cells contributing to the analysis. Data are from three independent experiments, and the results are plotted as mean ± SEM of BrdU-positive cells in percentage of vehicle group (set as 100%). *p < 0.05 versus vehicle.
Figure 3.
APα regulation of BrdU incorporation in rodent hippocampal neural progenitor cells is dose dependent. The dose-response of APα-induced proliferation was determined by chemiluminescence BrdU cell-proliferation ELISA. Exposure of hippocampal neurons to APα (100 p
m
to 1000 μ
m
) for 24 h induced a biphasic regulation of BrdU incorporation. At 100-500 n
m
, APα significantly increased BrdU incorporation by 20 ± 11 to 30 ± 10%. At 1000 n
m
, a reversal of the dose-response was first apparent and shifted to repression of proliferation at >10 μ
m
, with 1000 μ
m
generating the greatest (40 ± 15%) repression. As a positive control, hippocampal neurons were treated with EGF (20 ng/ml), which induced a 40 ± 9% increase in BrdU incorporation. Data are from three independent assays conducted in octuplets. Results were plotted as percentage increase versus control (mean ± SEM). *p < 0.05 versus vehicle.
Figure 4.
APα increases the proliferation of GFP-labeled hippocampal neural progenitor cells and the total number of cells. Cultures were treated with vehicle, 500 n
m
APα, or 500 APβ in the presence of MuLV-GFP retroviral particles (2 × 10⁶/ml) for 4 h and further incubated with APα, APβ, or vehicle in the absence of MuLV-GFP retroviral particles for 44-48 h. A, FACS profile. Area E presents the MuLV-GFP fluorescent cells, and area D presents the nonfluorescent cells. Results of FACS analysis indicated a greater number of cells sorted to the E fluorescent region. B, The relative percentage of positive MuLV-GFP cells was plotted and shows that APα induced a 27% increase in the number of FACS sorted GFP-labeled neural progenitor cells, which was significantly increased above control and APβ conditions. The stereoisomer APβ was without effect on GFP incorporation into hippocampal neural progenitor cells. C, Ratio of the total number of cells determined by particle size analyzer set to detect particles of 12-25 μm. Date derived from analysis of vehicle condition were set to 1, and data from other conditions are plotted relative to a vehicle value of 1. Analysis of total number of cells revealed that both 250 and 500 n
m
APα induced a significant increase in the number of cells. Data were derived from three independent experiments, analyzed by one-way ANOVA, followed by Neuman-Keuls post hoc analysis, and are presented as mean ± SEM. D, Fluorescent microscopy images of MuLV-GFP-labeled cells. Each panel of D shows the fluorescent image overlaid onto the differential interference contrast image to visualize the underlying cells. Scale bar, 20 μm. E, Coimmunolabeling of GFP-positive cells with the neuron-specific marker Tuj1 (red). Cells that coexpress GFP and Tuj1 appear yellow and label those cells that have divided and express a neuron-specific phenotype. Nuclei were counterstained with DAPI (blue). Scale bar, 20 μm.
Figure 5.
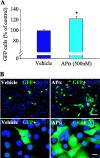
APα increased the number of MuLV-GFP-positive HT-22 cells. HT-22 cells were incubated with APα or vehicle in the presence of MuLV-GFP viral particles for 4 h and further incubated with APα or vehicle for another 44-48 h. The cells were either collected and sorted by FACS to analyze the number of GFP-positive cells or fixed to observe under fluorescent microscopy. A, Bar graph depicts the percentage of GFP-positive cells in the APα group versus vehicle control (set as 100). *p < 0.01 versus control. B, Fluorescent microscopic images showing morphology and relative density of GFP-positive cells in the APα-treated group versus control at low (top) and high (bottom) magnifications. Scale bars, 20 μm.
Figure 6.
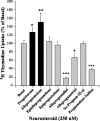
The neurogenic property of APα is specific and not shared by isomers or other steroids in the biosynthetic pathway. Rat hippocampal neurons were loaded with 1 μCi/ml [3H]thymidine in the presence or absence of the indicated neurosteroids at 37°C for 24 h. APα induced a 150% increase in [3H]thymidine incorporation relative to control. Moreover, DNA synthesis was specific to APα compared with other structurally and chemically similar steroids. P4, the precursor molecule to APα, also induced a modest increase in [3H]thymidine incorporation; however, the stereoisomers of allopregnanolone, epiallopregnanolone, and APβ, as well as 5α-pregnan-3β-ol, were without effect. Additionally, allopregnanediol, allopregnantriol, and pregnenolone sulfate induced a significant decrease in [3H]thymidine incorporation. Data are expressed as mean ± SEM. *p < 0.05; **p < 0.01; ***p < 0.001.
Figure 7.
APα regulates cell-cycle gene expression. Cultures of hippocampal neurons were treated with vehicle or 500 n
m
APα for 24 h, followed by extraction of total RNA. A, Gene array of cell-cycle-related gene expression. Nonradioactive probes were prepared and hybridized to a 96-gene miniarray. Two housekeeping genes (β-actin and GAPDH) were used as internal controls. Two blanks and pUC18 from bacterial plasmid were used as negative controls. Data were represented as fold change of mRNA expression in APα-treated neurons versus control (mean ± SEM) as determined by optical density. Results of these analyses in cultured hippocampal neurons indicate that APα induced a marked increase in genes that promote progression through the cell cycle while inhibiting genes associated with exiting the cell cycle. APα induced an eightfold increase in cyclin E, which promotes progression from G1 to S phase, and a more than twofold increase in two well defined cell proliferation markers, CDC2 (also known as CDK1) and PCNA. In parallel to an increase in cell-cycle progression genes, APα inhibited the expression of CDK4 and CDK6 inhibitors and ubiquitin and cullin 3, which are associated with exiting the cell cycle. Two housekeeping genes, actin and GAPDH, were unchanged. Data were from three separate experiments, and multivariant ANOVA statistical analysis indicated that the increase and decrease were statistically significant, as presented in Table 3. B, Validation of the gene-array results by real-time RT-PCR. APα induced a significant increase in mRNA expression of cyclin A2, cyclin B1, cyclin E, CDC2, and PCNA mRNA, whereas APα induced a significant reduction in mRNA for cyclin-dependent kinase inhibitor 2C (p18, inhibits CDK4) and ubiquitin-activating enzyme E1 (Ube1X). These quantitative PCR data are entirely consistent with the gene-array results. Data are depicted as fold change of mRNA expression in APα-treated neurons versus vehicle control (mean ± SEM) from three separate experiments. Controls were set to zero. *p < 0.05.
Figure 8.
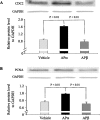
APα increases protein expression of CDC2 and PCNA. Rat hippocampal neurons in primary culture were treated with vehicle, APα (500 n
m
), or APβ (500 n
m
) for 24 h and processed for Western blots. Results of Western blot analysis indicate that APα induced a significant increase in the protein level for CDC2 (A) and PCNA (B). The increase in protein level was specific to APα, because the stereoisomer APβ was without effect. Bar graphs represent mean ± SEM, and data were analyzed by one-way ANOVA, followed by Neuman-Keuls post hoc analysis.
Figure 9.
APα-induced proliferation of neural progenitor cells requires activation of the L-type calcium channel. MuLV-GFP viral particle-infected rat hippocampal neurons were treated with vehicle, nifedipine (an L-type calcium channel antagonist), APα, or APα plus nifedipine. Nifidipine (10 μ
m
) completely abolished the proliferative effect of APα, which was detected by FACS analysis of GFP-positive cells. Data are from three independent experiments and presented as percentage of GFP-positive cells in each group versus control (set as 100%). *p < 0.01 versus control, nifedipine, or APα plus nifedipine.
Figure 10.
APα increases BrdU incorporation in human neural stem cells from the cerebral cortex in a dose-dependent manner. A, BrdU incorporation in human cerebral cortical stem cells was measured by a chemiluminescence BrdU ELISA. APα induced a dose-dependent biphasic increase in BrdU incorporation. The minimally effective concentration was 1 n
m
APα (38 ± 10% increase), with the maximal proliferative effect achieved at 10-500 n
m
APα (43 ± 14 to 49 ± 15% increase). At 1000 n
m
, a reversal of the increase in BrdU incorporation was apparent. The positive control, bFGF (20 ng/ml) plus heparin (5 μ
m
/ml) induced a 30 ± 9% increase in BrdU incorporation versus control. Data were derived from at least three independent assays conducted in octuplets. Results were plotted as percentage of vehicle control (mean ± SEM). **p < 0.01 versus vehicle; ***p < 0.001 versus control. B shows are presentative cluster of nestin-positive neural stem cells, and C shows Tuj1-positive human neural stem cells. Cell nuclei were counterstained with DAPI. Scale bar, 15 μm.
Similar articles
- Allopregnanolone-induced rise in intracellular calcium in embryonic hippocampal neurons parallels their proliferative potential.
Wang JM, Brinton RD. Wang JM, et al. BMC Neurosci. 2008 Dec 3;9 Suppl 2(Suppl 2):S11. doi: 10.1186/1471-2202-9-S2-S11. BMC Neurosci. 2008. PMID: 19090984 Free PMC article. - BM88 is an early marker of proliferating precursor cells that will differentiate into the neuronal lineage.
Koutmani Y, Hurel C, Patsavoudi E, Hack M, Gotz M, Thomaidou D, Matsas R. Koutmani Y, et al. Eur J Neurosci. 2004 Nov;20(10):2509-23. doi: 10.1111/j.1460-9568.2004.03724.x. Eur J Neurosci. 2004. PMID: 15548196 - Neural stem and progenitor cells in nestin-GFP transgenic mice.
Mignone JL, Kukekov V, Chiang AS, Steindler D, Enikolopov G. Mignone JL, et al. J Comp Neurol. 2004 Feb 9;469(3):311-24. doi: 10.1002/cne.10964. J Comp Neurol. 2004. PMID: 14730584 - Ginsenoside Rg1 promotes proliferation of hippocampal progenitor cells.
Shen LH, Zhang JT. Shen LH, et al. Neurol Res. 2004 Jun;26(4):422-8. doi: 10.1179/016164104225016047. Neurol Res. 2004. PMID: 15198871
Cited by
- Allopregnanolone: Regenerative therapeutic to restore neurological health.
Hernandez GD, Brinton RD. Hernandez GD, et al. Neurobiol Stress. 2022 Nov 5;21:100502. doi: 10.1016/j.ynstr.2022.100502. eCollection 2022 Nov. Neurobiol Stress. 2022. PMID: 36532370 Free PMC article. - Enhanced remyelination during late pregnancy: involvement of the GABAergic system.
Kalakh S, Mouihate A. Kalakh S, et al. Sci Rep. 2019 May 22;9(1):7728. doi: 10.1038/s41598-019-44050-4. Sci Rep. 2019. PMID: 31118452 Free PMC article. - Mitochondria- and Oxidative Stress-Targeting Substances in Cognitive Decline-Related Disorders: From Molecular Mechanisms to Clinical Evidence.
Lejri I, Agapouda A, Grimm A, Eckert A. Lejri I, et al. Oxid Med Cell Longev. 2019 May 12;2019:9695412. doi: 10.1155/2019/9695412. eCollection 2019. Oxid Med Cell Longev. 2019. PMID: 31214285 Free PMC article. Review. - Allopregnanolone promotes regeneration and reduces β-amyloid burden in a preclinical model of Alzheimer's disease.
Chen S, Wang JM, Irwin RW, Yao J, Liu L, Brinton RD. Chen S, et al. PLoS One. 2011;6(8):e24293. doi: 10.1371/journal.pone.0024293. Epub 2011 Aug 30. PLoS One. 2011. PMID: 21918687 Free PMC article. - Allopregnanolone levels are reduced in temporal cortex in patients with Alzheimer's disease compared to cognitively intact control subjects.
Naylor JC, Kilts JD, Hulette CM, Steffens DC, Blazer DG, Ervin JF, Strauss JL, Allen TB, Massing MW, Payne VM, Youssef NA, Shampine LJ, Marx CE. Naylor JC, et al. Biochim Biophys Acta. 2010 Aug;1801(8):951-9. doi: 10.1016/j.bbalip.2010.05.006. Epub 2010 May 19. Biochim Biophys Acta. 2010. PMID: 20488256 Free PMC article.
References
- Ashworth R, Bolsover SR (2002) Spontaneous activity-independent intracellular calcium signals in the developing spinal cord of the zebrafish embryo. Brain Res Dev Brain Res 139: 131-137. - PubMed
- Baulieu EE (1997) Neurosteroids: of the nervous system, by the nervous system, for the nervous system. Recent Prog Horm Res 52: 1-32. - PubMed
- Baulieu EE, Robel P (1990) Neurosteroids: a new brain function? J Steroid Biochem Mol Biol 37: 395-403. - PubMed
- Baulieu EE, Schumacher M (2000) Progesterone as a neuroactive neurosteroid, with special reference to the effect of progesterone on myelination. Hum Reprod 15: 1-13. - PubMed
- Baulieu EE, Robel P, Schumacher M (2001) Neurosteroids: beginning of the story. Int Rev Neurobiol 46: 1-32. - PubMed
Publication types
MeSH terms
Substances
LinkOut - more resources
Full Text Sources
Other Literature Sources
Medical
Miscellaneous


