Early asymmetry of gene transcription in embryonic human left and right cerebral cortex - PubMed (original) (raw)
Early asymmetry of gene transcription in embryonic human left and right cerebral cortex
Tao Sun et al. Science. 2005.
Abstract
The human left and right cerebral hemispheres are anatomically and functionally asymmetric. To test whether human cortical asymmetry has a molecular basis, we studied gene expression levels between the left and right embryonic hemispheres using serial analysis of gene expression (SAGE). We identified and verified 27 differentially expressed genes, which suggests that human cortical asymmetry is accompanied by early, marked transcriptional asymmetries. LMO4 is consistently more highly expressed in the right perisylvian human cerebral cortex than in the left and is essential for cortical development in mice, suggesting that human left-right specialization reflects asymmetric cortical development at early stages.
Figures
Fig. 1
Dissection of human embryonic brain tissues and generation of human SAGE libraries. (A) A top view of a 14-week human embryonic brain. Tissues were dissected from perisylvian regions in the left (L) and right (R) hemispheres. (B) A side view of a 14-week human embryonic right hemisphere. Tissues in the frontal (f) (red) and occipital (o) (blue) ventricular regions containing dividing cells were dissected. The dorsal cortex (d) is on the top. (C) The left side view of a real 14-week human embryonic brain. The perisylvian region is circled. (D) Summary of human brain SAGE libraries. The male (M) and female (F) brains are listed. At least 55,000 tags were sequenced in each library. (E) Summary of differentially expressed genes detected by SAGE analysis between the left-right hemispheres. Numbers of genes that are highly expressed in the left (L>R) or right (L<R) are listed with confidence levels p>99% and 95%<p<99%.
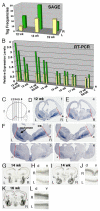
Fig. 2
Human LMO4 was highly expressed in the right hemisphere as detected by SAGE, real-time RT-PCR and in situ hybridization. (A) The human LMO4 expression levels in the perisylvian regions measured by SAGE (tag frequencies) in 12 (12 wk), 14 (14 wk) and 19 week (19 wk) brains. (B) The LMO4 expression levels between the left (L) and right (R) hemispheres were verified by real-time RT-PCR in eight human embryonic brains (12-19 weeks). Two data points from duplicated experiments for each sample are illustrated. (C-F) LMO4 expression in coronal sections cut from the frontal (f) to occipital (o) lobes of a human embryonic 12-week brain. The medial-lateral extent of LMO4 expression in the cortical plate between the left (white arrowheads) and right (black arrowheads) hemispheres was defined by a red line connecting the corticostriatal sulcus (cs) and the lateral border of the putamen (arrow). Numbers of sections illustrated in (C) are labeled in sections shown. Human LMO4 was more highly expressed in the cortical plates in the right hemispheres than the left in coronal sections of a 14-week brain (G-J) and 16-week brain (K-L). (H, J and L) are high power views of selected areas in panel G, I and K, respectively. The dorsal (d) and ventral (v) cortex is labeled.
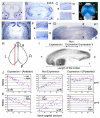
Fig. 3
The dynamic and asymmetric expression of Lmo4 in mouse brains. The patchy and asymmetric expression patterns of Lmo4 in the coronal sections in the left (L) and right (R) hemispheres of E11.5 (A), E15.5 (B) and P5 (E) mouse brains. Its expression appears uniform in the cortical plate in a sagittal section of a P17 brain (G). (C) and (F) High power views of Lmo4 expression in the cortical plates (cp) (red stars) in selected areas in panel (B) and (E), respectively. The dorsal cortex is on the left side. (D) The dorsal view of whole mount in situ hybridization of a P1 mouse brain. (I) Lmo4 expression was divided into the anterior (a) (Expression I), the posterior (p) (Expression II) and the Non-expression region in a sagittal section (H) of a P1 mouse cortex. The dorsal (d) and ventral (v) cortex is labeled. (J) and (K) Asymmetric expression of Lmo4 in the left-right hemispheres in representative P1 mouse cortices (totally 6 brains were similar to that in J and 4 brains to that in K).
Similar articles
- LMO4 functions as a co-activator of neurogenin 2 in the developing cortex.
Asprer JS, Lee B, Wu CS, Vadakkan T, Dickinson ME, Lu HC, Lee SK. Asprer JS, et al. Development. 2011 Jul;138(13):2823-32. doi: 10.1242/dev.061879. Development. 2011. PMID: 21652654 Free PMC article. - Genomic and evolutionary analyses of asymmetrically expressed genes in human fetal left and right cerebral cortex.
Sun T, Collura RV, Ruvolo M, Walsh CA. Sun T, et al. Cereb Cortex. 2006 Jul;16 Suppl 1:i18-25. doi: 10.1093/cercor/bhk026. Cereb Cortex. 2006. PMID: 16766703 - Dynamic spatiotemporal expression of LIM genes and cofactors in the embryonic and postnatal cerebral cortex.
Bulchand S, Subramanian L, Tole S. Bulchand S, et al. Dev Dyn. 2003 Mar;226(3):460-9. doi: 10.1002/dvdy.10235. Dev Dyn. 2003. PMID: 12619132 - Establishment of left-right asymmetry.
Yost HJ. Yost HJ. Int Rev Cytol. 2001;203:357-81. doi: 10.1016/s0074-7696(01)03011-x. Int Rev Cytol. 2001. PMID: 11131521 Review. - [Biological determinants of cerebral dominance].
Habib M, Galaburda AM. Habib M, et al. Rev Neurol (Paris). 1986;142(12):869-94. Rev Neurol (Paris). 1986. PMID: 3551007 Review. French.
Cited by
- Quantitative MRI Measures and Cognitive Function in People With Drug-Resistant Juvenile Myoclonic Epilepsy.
Crespo Pimentel B, Kuchukhidze G, Xiao F, Caciagli L, Hoefler J, Rainer L, Kronbichler M, Vollmar C, Duncan JS, Trinka E, Koepp MJ, Wandschneider B. Crespo Pimentel B, et al. Neurology. 2024 Oct 22;103(8):e209802. doi: 10.1212/WNL.0000000000209802. Epub 2024 Sep 20. Neurology. 2024. PMID: 39303180 Free PMC article. - The neocortical infrastructure for language involves region-specific patterns of laminar gene expression.
Wong MMK, Sha Z, Lütje L, Kong XZ, van Heukelum S, van de Berg WDJ, Jonkman LE, Fisher SE, Francks C. Wong MMK, et al. Proc Natl Acad Sci U S A. 2024 Aug 20;121(34):e2401687121. doi: 10.1073/pnas.2401687121. Epub 2024 Aug 12. Proc Natl Acad Sci U S A. 2024. PMID: 39133845 Free PMC article. - Autism-associated brain differences can be observed in utero using MRI.
Ortug A, Guo Y, Feldman HA, Ou Y, Warren JLA, Dieuveuil H, Baumer NT, Faja SK, Takahashi E. Ortug A, et al. Cereb Cortex. 2024 Apr 1;34(4):bhae117. doi: 10.1093/cercor/bhae117. Cereb Cortex. 2024. PMID: 38602735 - Strength of spatial correlation between gray matter connectivity and patterns of proto-oncogene and neural network construction gene expression is associated with diffuse glioma survival.
Kesler SR, Harrison RA, Schutz AT, Michener H, Bean P, Vallone V, Prinsloo S. Kesler SR, et al. Front Neurol. 2024 Mar 27;15:1345520. doi: 10.3389/fneur.2024.1345520. eCollection 2024. Front Neurol. 2024. PMID: 38601343 Free PMC article. - Using rare genetic mutations to revisit structural brain asymmetry.
Kopal J, Kumar K, Shafighi K, Saltoun K, Modenato C, Moreau CA, Huguet G, Jean-Louis M, Martin CO, Saci Z, Younis N, Douard E, Jizi K, Beauchamp-Chatel A, Kushan L, Silva AI, van den Bree MBM, Linden DEJ, Owen MJ, Hall J, Lippé S, Draganski B, Sønderby IE, Andreassen OA, Glahn DC, Thompson PM, Bearden CE, Zatorre R, Jacquemont S, Bzdok D. Kopal J, et al. Nat Commun. 2024 Mar 26;15(1):2639. doi: 10.1038/s41467-024-46784-w. Nat Commun. 2024. PMID: 38531844 Free PMC article.
References
- Corballis MC. Behav Brain Sci. 2003;26:199–208. discussion 208-60. - PubMed
- Galaburda AM, LeMay M, Kemper TL, Geschwind N. Science. 1978;199:852–6. - PubMed
- Geschwind DH, Miller BL. Am J Med Genet. 2001;101:370–81. - PubMed
- Toga AW, Thompson PM. Nat Rev Neurosci. 2003;4:37–48. - PubMed
- LeMay M, Culebras A. N Engl J Med. 1972;287:168–70. - PubMed
Publication types
MeSH terms
Substances
Grants and funding
- MH60233/MH/NIMH NIH HHS/United States
- R01 R37 NS35129/NS/NINDS NIH HHS/United States
- R37 MH060233/MH/NIMH NIH HHS/United States
- R01 NS035129/NS/NINDS NIH HHS/United States
- R56 MH060233/MH/NIMH NIH HHS/United States
- HHMI/Howard Hughes Medical Institute/United States
- R01 NS035129-03/NS/NINDS NIH HHS/United States
- R37 NS035129-05/NS/NINDS NIH HHS/United States
- R01 MH060233/MH/NIMH NIH HHS/United States
- R37 NS035129/NS/NINDS NIH HHS/United States
LinkOut - more resources
Full Text Sources
Other Literature Sources


