Sequential roles for Mash1 and Ngn2 in the generation of dorsal spinal cord interneurons - PubMed (original) (raw)
. 2005 Jun;132(12):2709-19.
doi: 10.1242/dev.01859. Epub 2005 May 18.
Affiliations
- PMID: 15901662
- PMCID: PMC1351036
- DOI: 10.1242/dev.01859
Sequential roles for Mash1 and Ngn2 in the generation of dorsal spinal cord interneurons
Amy W Helms et al. Development. 2005 Jun.
Abstract
The dorsal spinal cord contains a diverse array of neurons that connect sensory input from the periphery to spinal cord motoneurons and brain. During development, six dorsal neuronal populations (dI1-dI6) have been defined by expression of homeodomain factors and position in the dorsoventral axis. The bHLH transcription factors Mash1 and Ngn2 have distinct roles in specification of these neurons. Mash1 is necessary and sufficient for generation of most dI3 and all dI5 neurons. Unexpectedly, dI4 neurons are derived from cells expressing low levels or no Mash1, and this population increases in the Mash1 mutant. Ngn2 is not required for any specific neuronal cell type but appears to modulate the composition of neurons that form. In the absence of Ngn2, there is an increase in the number of dI3 and dI5 neurons, in contrast to the effects produced by activity of Mash1. Mash1 is epistatic to Ngn2, and, unlike the relationship between other neural bHLH factors, cross-repression of expression is not detected. Thus, bHLH factors, particularly Mash1 and related family members Math1 and Ngn1, provide a code for generating neuronal diversity in the dorsal spinal cord with Ngn2 serving to modulate the number of neurons in each population formed.
Figures
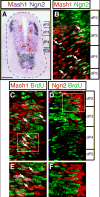
Figure 1. Co-localization of Mash1 and Ngn2 in the ventricular zone of the dorsal neural tube
E10.5 embryo transverse sections were processed for mRNA in situ hybridization (A) or immunofluorescence (B-F). (A) Pseudocolored overlay of adjacent sections hybridized with anti-sense Mash1 (pink) or Ngn2 (purple) probes to illustrate expression in the dorsoventral axis and possible overlap. (B) Double-label immunofluorescence shows Mash1 (red) and Ngn2 (green) in ventricular zone cells in the dorsal neural tube (region shown by bracket in (A), ventricular zone is at the left in each panel). Arrows indicate Mash1 and Ngn2 co-expressing cells (yellow). (C-F) Co-labeling with BrdU incorporation was performed to detect cells in S-phase. (C,E) Mash1(red) cells incorporate BrdU (green) (detected as yellow, arrows). (D,F) Ngn2 (red) cells rarely score positive for BrdU incorporation (green). (E,F) are higher magnification images of the regions boxed in (C,D). Scale bar 90 μm in (A) 25 μm in (B-D) and 15 μm in (E,F).
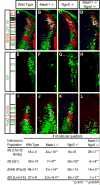
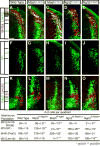
Figure 2. Mash1 is required for dI3 and dI5 neuron formation while Ngn2 represses formation of these populations
Immunofluorescence on transverse sections of neural tubes in wild type (A,E,I), Mash1_−/_− (B,F,J), Ngn2_−/− (C,G,K) and Mash1_−/−;Ngn2_−/_− (D,H,L) E10.5 mouse embryos. (A-D) Co-labeling with Brn3a and Lhx1/5 (yellow) marks dI2 neurons. There is a significant increase in dI2 neurons in the Mash1_−/− and Mash1_−/−;Ngn2_−/_− embryos but not Ngn2_−/_− relative to wild type. (E-H) Isl1 identifies dI3 neurons (green). In the Mash1_−/− and Mash1_−/−;Ngn2_−/_− mutant embryos, there is a dramatic decrease in dI3 neurons relative to wild type. In contrast, an increase in dI3 neurons in Ngn2_−/_− is detected. (I-L) Pax2 marks dI4 and dI6 neurons (green), and Lmx1b labels dI5 neurons (red). In the Mash1_−/− and Mash1_−/−;Ngn2_−/_− embryos, there is a complete loss of dI5. This is opposite in Ngn2_−/_− embryos where there is an increase in dI5 relative to wild type. dI4/6 neurons increase in the Mash1_−/_−, are unchanged in the Ngn2_−/−, and are dramatically reduced in the Mash1_−/−;Ngn2_−/_− relative to wild type embryos. Individual populations in each mutant were counted on at least three sections from at least three embryos each and cell counts are shown in the table. Because dI4 and dI6 neuronal populations cannot be distinguished in the Mash1 null, all Pax2 cells dorsal to the boundary where the first ventral Pax2 cell was found within the ventricular zone were counted, and as such, they are labeled as dI4/6. Scale bar is 50 μm.
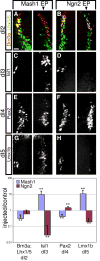
Figure 3. Excess Mash1 promotes dI3 and dI5 populations while excess Ngn2 represses them in the chick neural tube
Immunofluorescence on transverse sections of E4 (HH13-14) chick neural tubes electroporated with pMiWIII-Mash1 (A,D,G,J) or pMiWIII-Ngn2 (B,E,H,K) at E3 (HH23-24). The arrow above each row of panels indicates the electroporated side of the neural tube. Neuronal population dI2 was labeled by Brn3a;Lhx1/5 (yellow) (A,B), dI3 by Isl1 (C,D), dI4 by Pax2 (E,F), and dI5 by Lmx1b (G,H). Each panel is representative of the phenotype seen in at least three sections from at least three electroporated embryos. Relative induction or repression is expressed as the number of cells on the injected side divided by the number of cells on the control side and plotted in the graph on a logarithmic scale. ** indicates p<0.001. Scale bar is 25 μm.
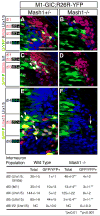
Figure 4. Mash1 cells primarily become dI3 and dI5 neurons
Immunofluorescence on transverse sections of _Mash1+/_− (A,C,E) or Mash1_−/_− (B,D,F) mouse embryos at E11.5 containing the transgene M1-GIC (see Supplementary Fig. 1S) and the Cre reporter allele R26R-YFP. (A-F) anti-GFP antibodies detect both GFP from M1-GIC and YFP when R26R-YFP reports the Cre activity from M1-GIC. These green labeled cells reflect cells with Mash1 or progeny of Mash1+ cells. (A,B) Brn3a;Lhx1/5 (pink) label dI2. These cells would appear white if they co-labeled with antibodies to GFP/YFP. The absence of white cells indicate dI2 do not derive from Mash1+ precursors (A). (C,D) Brn3a;Isl1 (pink) label dI3. White cells indicate co-labeling with antibodies to GFP/YFP and demonstrate Mash1+cells give rise to dI3 neurons (C, arrowheads) and these cells are absent in the null (D). (E,F) Lmx1b (red) labels dI5. The co-labeling with GFP/YFP (yellow) indicates dI5 are derived from Mash1+ cells (E, arrowheads) and these cells are absent in the null (F). Lhx1/5 (blue) labels dI4. Co-labeling with GFP/YFP (turquoise) indicate rare dI4 cells derived from Mash1+ cells (E, arrow), and these cells do not increase in Mash1_−/_− (F). Note that the increase in dI2 and dI4 seen at E10.5 cannot be attributed to fate switching of dI3 and dI5 precursor cells. The color of each neuronal population is shown on the left without and with (black background) co-labeling with the GFP/YFP. The total number of cells for each neuronal sub-type and the number of each that co-labels with GFP/YFP are shown in the table. Individual populations in each mutant were counted on at least three sections from at least three embryos each. Scale bar is 25 μm.
Figure 5. Mash1 inhibits Ngn1 but not Ngn2 expression in the dorsal neural tube
Immunofluorescence (A,B,D,E) and in situ hybridization (G-J) on transverse sections of E10.5 mouse neural tubes. (A-C) There is no change in levels of Ngn2 (green) between wild type (A) and Mash1_−/_− (B) embryos. (D-F) There is no change in expression of Mash1 (red) between wild type (D) and Ngn2_−/_− (E) embryos. (G-J) The dorsal domain of Ngn1 is expanded in Mash1_−/− (H, arrow) and Mash1_−/−;Ngn2_−/_− (J, arrow) relative to wild type (G) embryos. No change was detected in Ngn1 in Ngn2_−/_− (I) embryos. Each panel is representative of the phenotype seen in at least three sections from at least three embryos. Scale bar is 50 μm in (A,B,D,E) and 225 μm in (G-H).
Figure 6. Distinct functions for Mash1 and Ngn2 in specification of dorsal neurons
Immunofluorescence on cross sections of E11.5 mouse neural tubes where Mash1 and Ngn2 have been swapped into the Ngn2 and Mash1 locus, respectively: wild type (A,F,K), Mash1 KINgn2/+ (B,G,L), Mash1 KINgn2 (C,H,M), Ngn2 KIMash1/+ (D,I,N), and Ngn2 KIMash1(E,J,O). (A-E) Co-localization of Brn3a (red) and Lhx1/5 (green) detects dI2 neurons (yellow). (F-J) Isl1 (green) detects dI3 neurons. (K-O) Pax2 (green) and Lmx1b (red) detect dI4 and dI5 neurons, respectively. Cell counts for each marker on at least three sections from at least three embryos of each genotype are shown in the table. Because dI4 and dI6 populations cannot be distinguished in the Mash1 null, all Pax2 counts were completed by drawing a boundary line at the first Pax2 expressing cell found nearest the ventricular zone, and as such, they are labeled as dI4/6. ** indicates p<0.001 and * indicates p<0.01. Scale bar is 50 μm.
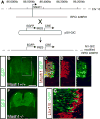
Supplemental Figure 1. Generation of the M1-GIC BAC and comparison of Mash1 and GFP
(A) BAC RPCI 428P21 from chromosome 10 containing the Mash1 locus was modified using homologous recombination (Yang et al., 1997). This modification utilized the shuttle vector pSV-GIC that contains a GFP-IRES-CRE cassette flanked by 1kb arms homologous to sequence in the Mash1 locus. This recombination precisely replaces the coding sequence of Mash1 with the GFP-IRES-CRE coding cassette. The resulting modified BAC is called M1-GIC. Transgenic mouse lines were generated with M1-GIC. The GFP reporter is low but it reflects the Mash1 pattern throughout multiple stages and multiple regions including the caudal neural tube (shown here), the telencephalon and diencephalon, sympathetic and enteric nervous systems (data not shown). (B-E) Immunofluorescence on transverse sections of neural tubes from E11.5 M1-GIC embryos with antibodies to GFP (green) and Mash1 (red) show GFP reflects the pattern of Mash1 with boundaries matching precisely in the dorsoventral axis. Persistence of GFP in lateral regions is likely due to the stability of GFP relative to Mash1. (B,F) Immunofluorescence using antibodies to detect GFP demonstrate expression of GFP in the Mash1 null background (F) is dramatically increased over wild type (B). These two images were taken at the identical GAIN to illustrate the difference in levels. This observation is consistent with the negative autoregulation of the Mash1 locus previously reported (Horton et al., 1999; Meredith and Johnson, 2000). (G) Because the persistence of GFP is found continuously throughout the lateral regions adjacent to dI3-dI5, but Mash1 is not required for dI4, we used Lhx1/5, a marker of dI4/6 to examine co-labeling with the GFP. Immunofluorescence using antibodies to detect GFP (green) and Lhx1/5 (red) shows very little overlap of GFP from the M1-GIC line with the dI4/6 population consistent with conclusions drawn from Fig. 4. Scale bar is 175 μm in (B,F) 100 μm in (C-E) and 50 μm in (G).
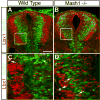
Supplemental Figure 2. Expanded ventricular zone and premature differentiation in the Mash1 null neural tube
Immunofluorescence of transverse sections of E11.5 wild type (A,C) or Mash1_−/_− (B,D) neural tube showing Lbx1 expression (red) and BrdU incorporation (green). (A,C) In the wild type, Lbx1 expression is in post-mitotic cells that are lateral to the ventricular zone and are almost exclusively BrdU negative (one positive in this section, arrow). (C) is a higher power image of the area boxed in (A). (B,D) In the Mash1 null, the ventricular zone is expanded and appears to bulge. There is no obvious increase in BrdU incorporation but Lbx1+cells are aberrantly located in the ventricular zone suggesting cells are initiating at least some differentiation program but are unable to leave the ventricular zone. Although a few cells incorporate BrdU in lateral regions, rarely have the Lbx1+cells within the ventricular zone incorporated BrdU. Taken together, the coordinated events that normally occur during neuronal differentiation in the dorsal neural tube are disrupted in the Mash1 null. The bulge seen in the dorsal neural tube appears to reflect the inability of cells to completely initiate their program of differentiation and move out of the ventricular zone. Scale bar is 70 μm in (A-B) and 25 μm in (C-D).
Similar articles
- Gsh2 is required for the repression of Ngn1 and specification of dorsal interneuron fate in the spinal cord.
Kriks S, Lanuza GM, Mizuguchi R, Nakafuku M, Goulding M. Kriks S, et al. Development. 2005 Jul;132(13):2991-3002. doi: 10.1242/dev.01878. Epub 2005 Jun 1. Development. 2005. PMID: 15930101 - Divergent functions of the proneural genes Mash1 and Ngn2 in the specification of neuronal subtype identity.
Parras CM, Schuurmans C, Scardigli R, Kim J, Anderson DJ, Guillemot F. Parras CM, et al. Genes Dev. 2002 Feb 1;16(3):324-38. doi: 10.1101/gad.940902. Genes Dev. 2002. PMID: 11825874 Free PMC article. - Signaling through BMP type 1 receptors is required for development of interneuron cell types in the dorsal spinal cord.
Wine-Lee L, Ahn KJ, Richardson RD, Mishina Y, Lyons KM, Crenshaw EB 3rd. Wine-Lee L, et al. Development. 2004 Nov;131(21):5393-403. doi: 10.1242/dev.01379. Epub 2004 Oct 6. Development. 2004. PMID: 15469980 - Specification of dorsal spinal cord interneurons.
Helms AW, Johnson JE. Helms AW, et al. Curr Opin Neurobiol. 2003 Feb;13(1):42-9. doi: 10.1016/s0959-4388(03)00010-2. Curr Opin Neurobiol. 2003. PMID: 12593981 Review. - Making sense out of spinal cord somatosensory development.
Lai HC, Seal RP, Johnson JE. Lai HC, et al. Development. 2016 Oct 1;143(19):3434-3448. doi: 10.1242/dev.139592. Development. 2016. PMID: 27702783 Free PMC article. Review.
Cited by
- ASCL1 regulates neurodevelopmental transcription factors and cell cycle genes in brain tumors of glioma mouse models.
Vue TY, Kollipara RK, Borromeo MD, Smith T, Mashimo T, Burns DK, Bachoo RM, Johnson JE. Vue TY, et al. Glia. 2020 Dec;68(12):2613-2630. doi: 10.1002/glia.23873. Epub 2020 Jun 23. Glia. 2020. PMID: 32573857 Free PMC article. - Histone Deacetylase 4 Downregulation Elicits Post-Traumatic Psychiatric Disorders through Impairment of Neurogenesis.
Saha P, Gupta R, Sen T, Sen N. Saha P, et al. J Neurotrauma. 2019 Dec 1;36(23):3284-3296. doi: 10.1089/neu.2019.6373. Epub 2019 Aug 1. J Neurotrauma. 2019. PMID: 31169064 Free PMC article. - Reprogramming chick RPE progeny cells to differentiate towards retinal neurons by ash1.
Mao W, Yan RT, Wang SZ. Mao W, et al. Mol Vis. 2008;14:2309-20. Epub 2008 Dec 12. Mol Vis. 2008. PMID: 19093008 Free PMC article. - Deriving Dorsal Spinal Sensory Interneurons from Human Pluripotent Stem Cells.
Gupta S, Sivalingam D, Hain S, Makkar C, Sosa E, Clark A, Butler SJ. Gupta S, et al. Stem Cell Reports. 2018 Feb 13;10(2):390-405. doi: 10.1016/j.stemcr.2017.12.012. Epub 2018 Jan 11. Stem Cell Reports. 2018. PMID: 29337120 Free PMC article. - A novel function of the proneural factor Ascl1 in progenitor proliferation identified by genome-wide characterization of its targets.
Castro DS, Martynoga B, Parras C, Ramesh V, Pacary E, Johnston C, Drechsel D, Lebel-Potter M, Garcia LG, Hunt C, Dolle D, Bithell A, Ettwiller L, Buckley N, Guillemot F. Castro DS, et al. Genes Dev. 2011 May 1;25(9):930-45. doi: 10.1101/gad.627811. Genes Dev. 2011. PMID: 21536733 Free PMC article.
References
- Bermingham NA, Hassan BA, Wang VY, Fernandez M, Banfi S, Bellen HJ, Fritzsch B, Zoghbi HY. Proprioceptor pathway development is dependent on MATH1. Neuron. 2001;30:411–422. - PubMed
- Bertrand N, Castro DS, Guillemot F. Proneural genes and the specification of neural cell types. Nat Rev Neuroscience. 2002;3:517–530. - PubMed
- Birren SJ, Lo L, Anderson DJ. Sympathetic neuroblasts undergo a developmental switch in trophic dependence. Development. 1993;119:597–610. - PubMed
- Briscoe J, Alessandra P, Jessell TM, Ericson J. A homeodomain protein code specifies progeitor cell identity and neuronal fate in the ventral neural tube. Cell. 2000;101:435–445. - PubMed
- Casarosa S, Fode C, Guillemot F. Mash1 regulates neurogenesis in the ventral telencephalon. Development. 1999;126:525–534. - PubMed
Publication types
MeSH terms
Substances
Grants and funding
- R01 HD037932/HD/NICHD NIH HHS/United States
- R01 NS032817/NS/NINDS NIH HHS/United States
- R01 HD 37932/HD/NICHD NIH HHS/United States
- R01 NS 32817/NS/NINDS NIH HHS/United States
LinkOut - more resources
Full Text Sources
Molecular Biology Databases
