A central role for S-nitrosothiols in plant disease resistance - PubMed (original) (raw)
Comparative Study
. 2005 May 31;102(22):8054-9.
doi: 10.1073/pnas.0501456102. Epub 2005 May 23.
Affiliations
- PMID: 15911759
- PMCID: PMC1142375
- DOI: 10.1073/pnas.0501456102
Comparative Study
A central role for S-nitrosothiols in plant disease resistance
Angela Feechan et al. Proc Natl Acad Sci U S A. 2005.
Abstract
Animal S-nitrosoglutathione reductase (GSNOR) governs the extent of cellular S-nitrosylation, a key redox-based posttranslational modification. Mutations in AtGSNOR1, an Arabidopsis thaliana GSNOR, modulate the extent of cellular S-nitrosothiol (SNO) formation in this model plant species. Loss of AtGSNOR1 function increased SNO levels, disabling plant defense responses conferred by distinct resistance (R) gene subclasses. Furthermore, in the absence of AtGSNOR1, both basal and nonhost disease resistance are also compromised. Conversely, increased AtGSNOR1 activity reduced SNO formation, enhancing protection against ordinarily virulent microbial pathogens. Here we demonstrate that AtGSNOR1 positively regulates the signaling network controlled by the plant immune system activator, salicylic acid. This contrasts with the function of this enzyme in mice during endotoxic shock, where GSNOR antagonizes inflammatory responses. Our data imply SNO formation and turnover regulate multiple modes of plant disease resistance.
Figures
Fig. 1.
AtGSNOR1 regulates intracellular SNO levels. (A) AtGSNOR1 transcript accumulation determined by Northern blot in the stated Arabidopsis genotypes. (B) GSNOR activity in leaf extracts from wild-type (WT) and mutant Arabidopsis lines. Enzyme activity assays were performed by determining the GSNO-dependent oxidation of NADH, with activity shown per mg of protein. (C) Total and low molecular weight (_M_r) SNO levels are shown for leaf extracts derived from the stated Arabidopsis plant lines either challenged or unchallenged with _Pst_DC3000(avrB). Total SNO levels (filled) were determined in whole-cell extracts and low _M_r SNO levels (open) in a fraction that had passed through a 5-kDa cutoff membrane, both were measured by photolysis chemiluminescence (15). Values were normalized against whole-cell lysate protein content. Error bars represent 95% confidence limits. These experiments were repeated twice with similar results.
Fig. 2.
R gene-mediated resistance requires ATGSNOR1 function. (A and C) Leaves from stated Arabidopsis plant lines 5 days postinoculation with either _Pst_DC3000(avrB) (A) or _Pst_DC3000(avrRps4) (C). (B and D) Growth of either _Pst_DC3000(avrB)(B) or _Pst_DC3000(avrRps4)(D) at 5 days postinoculation in the leaves of given genotypes. Error bars represent 95% confidence limits. These experiments were repeated twice with similar results.
Fig. 3.
ATGSNOR1 controls basal disease resistance. (A and B) Growth of virulent _Pst_DC3000 containing an empty vector (A) and images of the corresponding inoculated leaves from the stated Arabidopsis lines (B), 5 days postinoculation (dpi). (C and D) Quantification of the number of spores in the stated Arabidopsis genotypes inoculated with H. parasitica isolate Noco2 at 7 days postinoculation (C) and representative images of H. parasitica growth within the corresponding leaves (D). _H. parasitica_-inoculated leaves were stained with lactophenol trypan blue 7 days after inoculation. Leaf vascular tissue is stained pale blue, whereas oomycete hyphae and oospores stain more darkly. Error bars represent 95% confidence limits. These experiments were repeated three times with similar results.
Fig. 4.
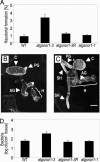
NHR is significantly reduced in atgsnor1-3 plants. (A) Growth of Bgt in the stated plant lines scored as the percentage of Bgt conidia that develop to form a haustorium. (B and C) Three-dimensional projections of confocal optical sections showing an abnormal unilateral Bgt haustorium on a wild-type (WT) plant (B) and a bilateral Bgt haustorium (22) with secondary hyphae on an atgsnor1-3 plant (C). PG, primary germ tube; C, conidia; AG, appressorial germ tube; H, haustorium; and SH, secondary hyphae. (Bars, 10 μM.) (D) Growth of Psp(NPS3121) on wild-type and mutant Arabidopsis lines at 5 days postinoculation. Error bars represent 95% confidence limits. These experiments were repeated twice with similar results.
Fig. 5.
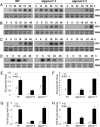
AtGSNOR1 positively regulates the SA-signaling network. (A–C) Northern blot analysis of PR1 transcript accumulation in the stated Arabidopsis lines at the listed times postinoculation of virulent _Pst_DC3000 (A), _Pst_DC3000(avrB)(B), and Bgt (C). (D) Accumulation of PR1 transcripts in wild-type (WT) and mutant Arabidopsis lines after exogenous application of 1 mM SA at the times indicated. (E and F) Concentrations of SA (E) and SAG (F) at 0 and 48 h postinoculation of _Pst_DC3000(avrB) into the given Arabidopsis lines. (G and H) Total SA concentrations in the stated plant lines after inoculation of virulent _Pst_DC3000 (G) and Bgt (H) at the times indicated. The kinetics of total SA accumulation is significantly delayed in response to _Pst_DC3000, reflecting a compatible interaction. Error bars represent 95% confidence limits. These experiments were repeated three times with similar results.
Similar articles
- S-nitrosoglutathione reductase affords protection against pathogens in Arabidopsis, both locally and systemically.
Rustérucci C, Espunya MC, Díaz M, Chabannes M, Martínez MC. Rustérucci C, et al. Plant Physiol. 2007 Mar;143(3):1282-92. doi: 10.1104/pp.106.091686. Epub 2007 Feb 2. Plant Physiol. 2007. PMID: 17277089 Free PMC article. - AtGSNOR1 function is required for multiple developmental programs in Arabidopsis.
Kwon E, Feechan A, Yun BW, Hwang BH, Pallas JA, Kang JG, Loake GJ. Kwon E, et al. Planta. 2012 Sep;236(3):887-900. doi: 10.1007/s00425-012-1697-8. Epub 2012 Jul 6. Planta. 2012. PMID: 22767201 - Nitric oxide and S-nitrosoglutathione function additively during plant immunity.
Yun BW, Skelly MJ, Yin M, Yu M, Mun BG, Lee SU, Hussain A, Spoel SH, Loake GJ. Yun BW, et al. New Phytol. 2016 Jul;211(2):516-26. doi: 10.1111/nph.13903. Epub 2016 Feb 24. New Phytol. 2016. PMID: 26916092 - GSNOR-mediated de-nitrosylation in the plant defence response.
Malik SI, Hussain A, Yun BW, Spoel SH, Loake GJ. Malik SI, et al. Plant Sci. 2011 Nov;181(5):540-4. doi: 10.1016/j.plantsci.2011.04.004. Epub 2011 Apr 21. Plant Sci. 2011. PMID: 21893250 Review. - Signaling Crosstalk between Salicylic Acid and Ethylene/Jasmonate in Plant Defense: Do We Understand What They Are Whispering?
Li N, Han X, Feng D, Yuan D, Huang LJ. Li N, et al. Int J Mol Sci. 2019 Feb 4;20(3):671. doi: 10.3390/ijms20030671. Int J Mol Sci. 2019. PMID: 30720746 Free PMC article. Review.
Cited by
- Maternal nitric oxide homeostasis impacts female gametophyte development under optimal and stress conditions.
Wang J, Guo X, Chen Y, Liu T, Zhu J, Xu S, Vierling E. Wang J, et al. Plant Cell. 2024 May 29;36(6):2201-2218. doi: 10.1093/plcell/koae043. Plant Cell. 2024. PMID: 38376990 - Contribution of Fdh3 and Glr1 to Glutathione Redox State, Stress Adaptation and Virulence in Candida albicans.
Tillmann AT, Strijbis K, Cameron G, Radmaneshfar E, Thiel M, Munro CA, MacCallum DM, Distel B, Gow NA, Brown AJ. Tillmann AT, et al. PLoS One. 2015 Jun 3;10(6):e0126940. doi: 10.1371/journal.pone.0126940. eCollection 2015. PLoS One. 2015. PMID: 26039593 Free PMC article. - Quantitative proteomics analysis reveals that S-nitrosoglutathione reductase (GSNOR) and nitric oxide signaling enhance poplar defense against chilling stress.
Cheng T, Chen J, Ef AA, Wang P, Wang G, Hu X, Shi J. Cheng T, et al. Planta. 2015 Dec;242(6):1361-90. doi: 10.1007/s00425-015-2374-5. Epub 2015 Aug 2. Planta. 2015. PMID: 26232921 - Phytochrome B enhances seed germination tolerance to high temperature by reducing S-nitrosylation of HFR1.
Ying S, Yang W, Li P, Hu Y, Lu S, Zhou Y, Huang J, Hancock JT, Hu X. Ying S, et al. EMBO Rep. 2022 Oct 6;23(10):e54371. doi: 10.15252/embr.202154371. Epub 2022 Sep 5. EMBO Rep. 2022. PMID: 36062942 Free PMC article. - The Key Roles of ROS and RNS as a Signaling Molecule in Plant-Microbe Interactions.
Khan M, Ali S, Al Azzawi TNI, Saqib S, Ullah F, Ayaz A, Zaman W. Khan M, et al. Antioxidants (Basel). 2023 Jan 25;12(2):268. doi: 10.3390/antiox12020268. Antioxidants (Basel). 2023. PMID: 36829828 Free PMC article. Review.
References
- Collins, N. C., Thordal-Christensen, H., Lipka, V., Bau, S., Kombrink, E., Qiu, J.-L., Hückelhoven, R., Stein, M., Freialdenhoven, A., Somerville, S. C., et al. (2003) Nature 425, 973–977. - PubMed
- Thordal-Christensen, H. (2003) Curr. Opin. Plant Biol. 6, 351–357. - PubMed
- Dangl, J. L. & Jones, J. D. G. (2001) Nature 411, 826–833. - PubMed
Publication types
MeSH terms
Substances
LinkOut - more resources
Full Text Sources


