Presynaptic Ca2+ requirements and developmental regulation of posttetanic potentiation at the calyx of Held - PubMed (original) (raw)
Comparative Study
Presynaptic Ca2+ requirements and developmental regulation of posttetanic potentiation at the calyx of Held
Natalya Korogod et al. J Neurosci. 2005.
Abstract
Large excitatory synapses in the auditory system, such as the calyx of Held, faithfully transmit trains of action potentials up to a frequency of a few hundred hertz, and these synapses are thought to display a limited repertoire of synaptic plasticity. Here, we show that brief trains of 100 Hz stimulation induce posttetanic potentiation (PTP) of transmitter release at the calyx of Held. In young rats [postnatal day 4 (P4) to P6], PTP could be induced with shorter 100 Hz trains compared with older age groups (P8-P10 and P12-P14), but the maximal amount of PTP was similar, with 200% of control EPSC amplitude. The size of the readily releasable pool of vesicles was not increased significantly during PTP. Bath application of the membrane-permeable Ca2+ chelator EGTA-AM suppressed PTP, indicating a role for presynaptic Ca2+ in PTP at the calyx of Held. Presynaptic Ca2+ imaging showed that the intracellular Ca2+ concentration, [Ca2+]i, was increased by 40-120 nM at the peak of PTP, and this "residual" [Ca2+]i decayed in parallel with PTP, with time constants in the range of 10-60 s. During whole-cell recording of the presynaptic calyx of Held, PTP was absent, and the decay of residual [Ca2+]i was strongly accelerated. The data show that the calyx of Held expresses a mechanism of transmitter release potentiation in which a small, sustained elevation of basal [Ca2+]i increases the transmitter release probability after trains of high-frequency stimulation.
Figures
Figure 1.
Posttetanic potentiation at the calyx of Held. A, Top, EPSCs in response to a pair of fiber stimulations separated by 10 ms, repeated every 10 s. The middle panel shows a 9.6 s stretch of postsynaptic current, and the bottom panel shows the average trace of n = 9 detected mEPSCs. B, EPSC in response to a 4 s, 100 Hz train of afferent fiber stimulation, applied 10 s after the last control EPSC shown in A. Only the first and the last 10 EPSCs in the train are shown, and the stimulation artifacts have been blanked for clarity. The middle panel shows a postsynaptic current record, starting 3.7 s after the end of the 100 Hz train. Note the strongly increased frequency of mEPSCs throughout the entire record. The bottom panel shows the average trace of all detected mEPSCs from this sweep (n = 245). C, EPSCs in response to a pair of stimuli repeated every 10 s after the 100 Hz train. The traces are grayscale coded, with the earliest traces after the 100 Hz train shown in light gray. D, Time course of EPSC amplitudes for the experiment shown in A-C. Filled and open circles represent amplitudes of the first and second EPSC, respectively. Note the transient overshoot of the first EPSC amplitude. E, mEPSC amplitude distribution for the control period (hatched bars) and for a period of 30 s after the 100 Hz train (open bars), corresponding to the time of development of maximal PTP. The mean mEPSC amplitudes were 30 and 33 pA for control and PTP, respectively. The data in A-E are from a recording in a P7 rat. F, Mean of the mEPSC amplitude distributions, plotted for individual cells for control conditions and after induction of PTP. G, Mean mEPSC frequencies (freq.) derived from individual cells before and after PTP induction. Note the strong increase in mEPSC frequency after the 100 Hz train. H, Maximal potentiation of the first and second EPSC amplitude for n = 8 cells. I, Paired-pulse ratio (EPSC2/EPSC1) for the control period and during maximal potentiation of the EPSCs. The data shown in F-I were obtained from recordings in P4-P7 rats. ampl., Amplitude; ctrl, control.
Figure 2.
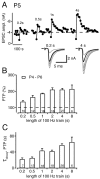
Dependence of PTP amplitude and duration on the length of 100 Hz induction trains. A, An experiment at P5, in which the PTP protocol shown in Figure 1 was applied several times. The length of the 100 Hz induction trains is indicated. The traces at the bottom are the averaged control EPSCs before induction (black trace; n = 5) and the first 10 EPSCs after the induction of PTP. ampl., Amplitude. B, Amplitude of PTP as a function of the length of the 100 Hz induction train for the age group of P4-P6. The number of cells investigated is indicated for each bar. C, Dependence of the decay time constant of PTP, estimated from fitting the decay phase of PTP with single-exponential functions, as a function of the length of the 100 Hz induction train. Error bars represent SEM.
Figure 3.
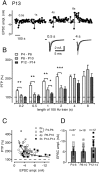
Developmental regulation of PTP at the calyx of Held. A, An experiment at P13, in which PTP was induced with 100 Hz trains of indicated lengths. Note that the shorter 100 Hz trains (0.5 s, 1 s) did not induce notable PTP in this cell. The inset shows sample traces for the 0.5 and 4 s induction trains. B, Amplitude of PTP as a function of the length of the 100 Hz induction train, separated for the age groups of P4-P6 (open bars; replotted from Fig. 2 B), P8-P10 (gray bars), and P12-P14 (black bars). Note that the short 100 Hz trains of 0.2-2 s induced significantly larger PTP at P4-P6 than in the older age groups. Asterisks indicate a significant difference between the indicated pairwise comparisons (*p < 0.05; **p < 0.01; ***p < 0.001; unpaired t test). Error bars represent SEM. C, Scatter plot of PTP amplitude as a function of the control EPSC amplitude. For the data obtained at P4-P6, results from 2 and 4 s induction trains are shown, whereas in the older age groups, only 4 s induction trains were analyzed, with the meaning of each symbol as indicated. The data set was fitted by an inverse function. Note the tendency toward smaller PTP for initially large EPSCs. D, Plot of average control EPSC amplitudes from individual cells for each age group. The average ± SD of each data set is shown superimposed. ampl., Amplitude.
Figure 4.
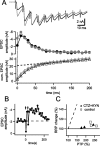
The RRP is not significantly increased during PTP. A, EPSCs in response to the fist 10 stimuli of a 4 s 100 Hz train, both for the first 4 s 100 Hz train, as well as for a second 4 s 100 Hz train applied 20 s later (top; black and gray traces, respectively). The middle panel shows the corresponding plot of EPSC amplitudes for the first 25 stimuli of each 100 Hz train, and the bottom panel shows the plot of cumulative (cum.) EPSC amplitudes, fitted with lines back-extrapolated to time 0 to obtain a measure for the RRP. Black and gray symbols show the results for the first and second 100 Hz trains, respectively. B, Time plot of EPSC amplitudes for the experiment illustrated in A, with the time of the two 4 s 100 Hz trains indicated by arrows. Note that the first 100 Hz train induced PTP of ∼170% of control, but the second 100 Hz train did not increase synaptic strength further. C, Plot of the relative pool size increase as a function of the PTP amplitude. The data points for cells with control extracellular solution and in the presence of 1 m
m
KYN and 0.1 m
m
CTZ are indicated. The unity line is indicated by the dashed line. The data in this figure were obtained in P4-P6 rats.
Figure 5.
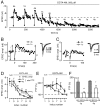
PTP and baseline synaptic strength are strongly reduced by the membrane-permeable Ca2+ chelator EGTA-AM. A, Plot of EPSC amplitudes versus time in an experiment in which PTP was induced with 100 Hz trains of 1 and 4 s in an alternating sequence. EGTA-AM (200 μ
m
) was applied at the indicated time. B, EPSC amplitudes during PTP in response to 1 and 4 s 100 Hz trains under control conditions. The amplitude values b, i, and p were used to calculate absolute and relative PTP in D and E. The traces on the right show the average EPSC before (black trace) and single EPSCs after (gray traces) PTP induction with a 1 s 100 Hz train. C, Same as B, but taken 27 min after the onset of the EGTA-AM application. D, Time plot of the average EPSC amplitude (gray symbol) and the absolute (abs.) PTP (corresponding to the amplitude value i in B). Open and filled symbols are absolute PTP for 1 and 4 s induction trains, respectively. The data are from n = 6 cells except the last three data points (n = 4 cells). E, Plot of the relative PTP, calculated according to (p/b) × 100 (see B). Open and filled symbols are for 1 and 4 s induction trains, respectively. Average data from n = 4 cells. F, Relative PTP in control (ctrl) conditions (gray bars) and after prolonged (> 30 min) application of EGTA-AM (open bars). Asterisks indicate statistical significance (*p < 0.05; **p < 0.01; paired t test). Error bars represent SEM. The data shown in this figure were obtained from P4-P6 rats. ampl., Amplitude; induc., induction.
Figure 6.
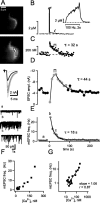
Presynaptic [Ca2+]i dynamics associated with PTP. The fluorescent Ca2+ indicator fura-4F was preloaded into calyces by a brief whole-cell recording episode. A, Fluorescence images taken after the experiment (high resolution; top) and during the experiment (bottom). n = 7 superpixels used for deriving the [Ca2+]i traces shown in B and C are indicated. B-E, Time course of [Ca2+]i (B, C), of EPSC amplitudes (ampl.; D), and of mEPSC frequency (E). At time point 0, a 2 s 100 Hz train was applied. In B, [Ca2+]i is shown for the entire protocol and for an expanded time during the 100 Hz train (inset). In C, the [Ca2+]i scale is increased, such that only [Ca2+]i up to 350 n
m
is visible. With this scale, the slowest component of decay of residual [Ca2+]i becomes clearly visible, which was fitted by an exponential function with time constant τ = 32 s. The decay of PTP in D was also fitted with an exponential function, giving τ = 44 s. The time of maximal PTP is indicated by horizontal brackets in C and D. The traces in D show the EPSCs before and after induction of PTP. In E, mEPSCs are shown for the time points indicated with a, b, and c in the time plot of E. F, Plot of mEPSC frequency as a function of presynaptic [Ca2+]i during the decaying phase of PTP. G, Same data as in F, but on double-logarithmic scales. The logarithmized data were fitted with a line, giving a slope of 1.06. freq., Frequency. The data in this figure were obtained from a P5 rat.
Figure 7.
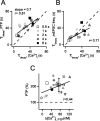
The apparent Ca2+ dependence of PTP at the calyx of Held. A, Plot of the decay time constants of PTP as a function of the decay time constants of presynaptic residual [Ca2+]i. The data points are grayscale coded according to the length of the 100 Hz induction train, as indicated. The data were fitted by linear regression. B, Plot of the decay time constant of mEPSC frequency (freq.) as a function of the decay time constant of presynaptic residual [Ca2+]i. The data were fitted by linear regression. In A and B, the dashed line represents the unity line. C, Plot of the PTP amplitudes as a function of the presynaptic [Ca2+]i at the time of maximal PTP (see Fig. 4_C, D_, brackets). Linear regression gave a correlation coefficient of r = 0.44. [Ca2+]i is given as the increment over baseline [Ca2+]i. The average ± SD of all data points >40 μ
m
Δ[Ca2+]i are superimposed. The data in this figure were obtained from P4-P6 rats.
Figure 8.
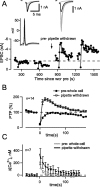
Whole-cell recording of the presynaptic nerve terminal reversibly suppresses PTP and accelerates the decay of residual [Ca2+]i. A, Time plot of EPSC amplitudes. In this experiment, the PTP induction protocol (4 s, 100 Hz train) was given twice under conditions of presynaptic whole-cell recording (wcr pre) and another two times after withdrawal of the presynaptic pipette. The traces on the left show EPSCs and presynaptic APs for control (black traces) and after the induction of PTP (gray traces). The traces on the right show EPSCs for control (black traces) and after the induction of PTP (gray traces), after the presynaptic pipette was removed. B, Average time course of relative EPSC amplitude before and after 100 Hz trains of 4 s duration. Filled symbols are under presynaptic whole-cell recording; open symbols are after withdrawal of the presynaptic pipette in the same recordings. C, Average residual [Ca2+]i measured under conditions of presynaptic whole-cell recording (gray trace) and after pipette removal (black trace) for a subset of cells shown in B. [Ca2+]i is shown as the increment over the baseline [Ca2+]i recorded in each cell. The data in this figure were obtained from P8-P10 rats. Error bars represent SEM.
Similar articles
- Developmental transformation of the release modality at the calyx of Held synapse.
Fedchyshyn MJ, Wang LY. Fedchyshyn MJ, et al. J Neurosci. 2005 Apr 20;25(16):4131-40. doi: 10.1523/JNEUROSCI.0350-05.2005. J Neurosci. 2005. PMID: 15843616 Free PMC article. - Quantitative relationship between transmitter release and calcium current at the calyx of held synapse.
Sakaba T, Neher E. Sakaba T, et al. J Neurosci. 2001 Jan 15;21(2):462-76. doi: 10.1523/JNEUROSCI.21-02-00462.2001. J Neurosci. 2001. PMID: 11160426 Free PMC article. - Neurosteroid-induced plasticity of immature synapses via retrograde modulation of presynaptic NMDA receptors.
Mameli M, Carta M, Partridge LD, Valenzuela CF. Mameli M, et al. J Neurosci. 2005 Mar 2;25(9):2285-94. doi: 10.1523/JNEUROSCI.3877-04.2005. J Neurosci. 2005. PMID: 15745954 Free PMC article. - Estimation of quantal parameters at the calyx of Held synapse.
Sakaba T, Schneggenburger R, Neher E. Sakaba T, et al. Neurosci Res. 2002 Dec;44(4):343-56. doi: 10.1016/s0168-0102(02)00174-8. Neurosci Res. 2002. PMID: 12445623 Review. - Calcium and transmitter release.
Zucker RS. Zucker RS. J Physiol Paris. 1993;87(1):25-36. doi: 10.1016/0928-4257(93)90021-k. J Physiol Paris. 1993. PMID: 7905762 Review.
Cited by
- Mechanisms underlying presynaptic Ca2+ transient and vesicular glutamate release at a CNS nerve terminal during in vitro ischaemia.
Lee SY, Kim JH. Lee SY, et al. J Physiol. 2015 Jul 1;593(13):2793-806. doi: 10.1113/JP270060. Epub 2015 May 22. J Physiol. 2015. PMID: 25833340 Free PMC article. - Plasticity-dependent, full detonation at hippocampal mossy fiber-CA3 pyramidal neuron synapses.
Vyleta NP, Borges-Merjane C, Jonas P. Vyleta NP, et al. Elife. 2016 Oct 25;5:e17977. doi: 10.7554/eLife.17977. Elife. 2016. PMID: 27780032 Free PMC article. - Active presynaptic ribosomes in the mammalian brain, and altered transmitter release after protein synthesis inhibition.
Scarnati MS, Kataria R, Biswas M, Paradiso KG. Scarnati MS, et al. Elife. 2018 Oct 30;7:e36697. doi: 10.7554/eLife.36697. Elife. 2018. PMID: 30375975 Free PMC article. - Munc18-1 is a dynamically regulated PKC target during short-term enhancement of transmitter release.
Genc O, Kochubey O, Toonen RF, Verhage M, Schneggenburger R. Genc O, et al. Elife. 2014 Feb 11;3:e01715. doi: 10.7554/eLife.01715. Elife. 2014. PMID: 24520164 Free PMC article. - Posttetanic potentiation critically depends on an enhanced Ca(2+) sensitivity of vesicle fusion mediated by presynaptic PKC.
Korogod N, Lou X, Schneggenburger R. Korogod N, et al. Proc Natl Acad Sci U S A. 2007 Oct 2;104(40):15923-8. doi: 10.1073/pnas.0704603104. Epub 2007 Sep 20. Proc Natl Acad Sci U S A. 2007. PMID: 17884983 Free PMC article.
References
- Awatramani GB, Blackmer T, Trussell LO (2004) Mechanism of enhancement of intra-terminal calcium by weak depolarization in the calyx of Held. Soc Neurosci Abstr 30: 736.12.
- Bollmann J, Sakmann B, Borst J (2000) Calcium sensitivity of glutamate release in a calyx-type terminal. Science 289: 953-957. - PubMed
- Borst JGG, Sakmann B (1996) Calcium influx and transmitter release in a fast CNS synapse. Nature 383: 431-434. - PubMed
Publication types
MeSH terms
Substances
LinkOut - more resources
Full Text Sources
Research Materials
Miscellaneous

