Pincher-mediated macroendocytosis underlies retrograde signaling by neurotrophin receptors - PubMed (original) (raw)
Comparative Study
Pincher-mediated macroendocytosis underlies retrograde signaling by neurotrophin receptors
Gregorio Valdez et al. J Neurosci. 2005.
Abstract
Retrograde signaling by neurotrophins is crucial for regulating neuronal phenotype and survival. The mechanism responsible for retrograde signaling has been elusive, because the molecular entities that propagate Trk receptor tyrosine kinase signals from the nerve terminal to the soma have not been defined. Here, we show that the membrane trafficking protein Pincher defines the primary pathway responsible for neurotrophin retrograde signaling in neurons. By both immunofluorescence confocal and immunoelectron microscopy, we find that Pincher mediates the formation of newly identified clathrin-independent macroendosomes for Trk receptors in soma, axons, and dendrites. Trk macroendosomes are derived from plasma membrane ruffles and subsequently processed to multivesicular bodies. Pincher similarly mediates macroendocytosis for NGF (TrkA) and BDNF (TrkB) in both peripheral (sympathetic) and central (hippocampal) neurons. A unique feature of Pincher-Trk endosomes is refractoriness to lysosomal degradation, which ensures persistent signaling through a critical effector of retrograde survival signaling, Erk5 (extracellular signal-regulated kinase 5). Using sympathetic neurons grown in chamber cultures, we find that block of Pincher function, which prevents Trk macroendosome formation, eliminates retrogradely signaled neuronal survival. Pincher is the first distinguishing molecular component of a novel mechanistic pathway for endosomal signaling in neurons.
Figures
Figure 1.
Pincher is expressed in peripheral and central neurons. Pincher expression in SCG neurons (SCG) and hippocampus (Hipp) was determined by Western blot of whole-cell extracts probed with anti-Pincher antibody for protein (A) and by quantitative reverse transcription-PCR for mRNA (B), as described in Materials and Methods. A, Control lane (Con) identifies Pincher band (compared with band for other Pincher family member below) that is increased in SCG neurons infected with adenovirus driving Pincher expression. B, In reverse transcription-PCR, the cycle threshold for Pincher is compared with that for the standard GAPDH.
Figure 2.
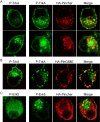
Pincher mediates formation of TrkA-signaling endosomes that associate with active Erk5 kinase in SCG neurons. Cultured SCG neurons were transfected with a TrkA construct alone (A, B, left) or infected with a HA-Pincher-containing adenovirus alone (C) or together with TrkA transfection (A, right) or were infected with dominant-negative mutant HA-PincherG68E-containing adenovirus together with TrkA transfection (B, right) or uninfected (C, left). Neurons were then treated with NGF for 15 min (A, top row, C) or continuously (A, bottom row, B), fixed, stained, and confocal microscopy was performed as described in Materials and Methods. Active, P-TrkA (green; A, B), HA-Pincher (red; A, C), HA-PincherG68E (HA-PinG68E; B), and P-Erk5 (green; C) were visualized using anti-P-TrkA, anti-HA, and anti-P-Erk5 antibodies, respectively. Scale bar: (in A) 2 μm.
Figure 3.
RNAi-mediated repression of Pincher expression retards TrkA internalization. A, The ability of Pincher-specific RNAi to block Pincher protein expression was determined in cell extracts taken from PC12 cells transfected with a HA-Pincher (Con) construct alone or together with a Pincher-RNAi (RNAi) construct using Western blots probed with anti-HA antibody (top). Levels of endogenous Pincher probed using anti-Pincher antibody was decreased after infection with adenovirus driving Pincher-RNAi (bottom). The band corresponding to Pincher was identified by its increased intensity (compared with other Pincher family members), seen after infection of cells with adenovirus driving HA-Pincher expression, as in Figure 1 A (data not shown). B, Internalization of TrkA was compared between control and Pincher-RNAi-expressing PC12 cells. After NGF treatments as indicated, cell-surface TrkA was biotinylated, immunoprecipitated, and identified by Western blot using anti-TrkA antibody, as described in Materials and Methods. Equal amounts of PC12 extract proteins were loaded in each lane. C, The effects of Pincher-RNAi expression on internalized surface TrkA were directly assessed in PC12 cells. Cells were surface biotinylated, treated with NGF, then debiotinylated as described in Materials and Methods. The remaining biotinylated (internalized) TrkA was detected as in B. D, The effects of Pincher-RNAi expression on internalization of surface TrkA was determined in SCG neurons. NGF-treated neurons were infected, surface biotinylated, and TrkA was detected as in B. β-Tubulin, probed for in the same blot as the SCG extracts (data not shown), was used to control for protein loading. Total TrkA protein was determined from the same PC12 cell and SCG extracts used to measure surface TrkA internalization. Con, Control.
Figure 4.
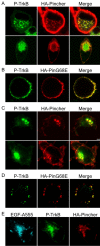
Pincher mediates endocytosis of ligand-bound TrkB in SCG and hippocampal neurons. Cultured SCG (A, B) or hippocampal (C-E) neurons were double infected with adenoviruses containing TrkB-GFP or HA-Pincher (A, C), TrkB-GFP or HA-PincherG68E (B, D), an EGFR/TrkB chimera (with extracellular domain of EGFR and transmembrane with intracellular domains of TrkB or HA-Pincher; E). Neurons were treated with BDNF for 15 min (A, C, top) or 1 h (A-C, bottom, D) or treated for 15 min with EGF coupled to Alexa555 (E). Neurons were fixed and stained as in Figure 2 for P-TrkB (green; A-E), HA-Pincher (red; A, C, E), HA-PincherG68E (HA-PinG68E; red; B, D), and EGF-Alexa555 (blue; EGF-A555; E), which were visualized directly. Scale bar: (in C) 2 μm.
Figure 5.
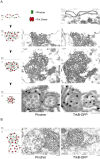
Ultrastructural characterization depicts stages of a novel pathway of Pincher-mediated Trk macroendocytosis. Cultured SCG neurons (B, left) or hippocampal neurons (A, B, right) were infected with adenoviruses containing TrkB-GFP (A, top right, B, right) or HA-Pincher (B, left) or were double infected with both viruses (A, 3 bottom panels), treated with BDNF for 30 min, and immunogold electron microscopy using anti-GFP (TrkB-GFP) or anti-Pincher (Pincher) antibodies performed as described in Materials and Methods. Immunogold-labeled TrkB-GFP and Pincher as shown in A are associated with plasma membrane ruffles (top; Pincher not shown), complex plasma membrane ruffles with pinocytic vesicles (second panel), internalized complex ruffles termed macroendosomes (third panel), and MVBs (bottom panel) as shown in the gold-labeled serial sections (second through fourth panels). All structures in A are double labeled for TrkB-GFP and HA-Pincher, but only the MVBs (bottom) show sorted labeling with both on the outer membrane and only TrkB-GFP on internal vesicles. In B, intermediates in which macroendosomes are fused to budding MVBs are similarly gold labeled for TrkB-GFP and HA-Pincher. Cells that were treated with BDNF at various times between 3 min and 1 h were analyzed by immunogold EM for Pincher and TrkB-GFP (data not shown). Only the 30 min time point was exhaustively analyzed by immunogold labeling of alternate serial sections as depicted here, which represents structures seen at all time points. The diagrams on the left side depict interpretive sequential ordering of composites gleaned from the analyses of all time points and correspond to the adjacent EM photos. Scale bars, 0.2 μm.
Figure 6.
Pincher is associated with Trk endosomes that resist lysosomal processing. Cultured neurons were infected with adenoviruses driving expression of and immunogold EM labeled for GFP (Control), HA-Pincher (Pincher), TrkB-GFP (TrkB), or double infected with the latter two viruses (TrkB + Pincher; only TrkB-GFP labeling shown), as in Figures 4 and 5. Photomicrographs depict typical examples of MVBs in each case. Forty-five percent of the MVBs in cells expressing TrkB-GFP alone was electron dense, indicating lysosomal processing. Scale bars, 0.2 μm.
Figure 7.
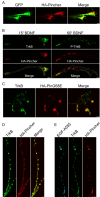
Pincher mediates endocytosis and trafficking of ligand-bound TrkB in axons and dendrites. Cultured SCG neurons (A-C) or hippocampal neurons (D, E) were infected with adenovirus either independently driving expression of both GFP and HA-Pincher (A) or only HA-Pincher (E) or were double infected with viruses containing TrkB-GFP together with HA-Pincher (B, D) or with HA-PincherG68E (HA-PinG68E; C). EGFR/TrkB construct was transfected into HA-Pincher-expressing neurons (E). SCG axonal processes with growth cones (A-C) and hippocampal processes (D, E) were visualized (P-TrkB, green; HA-Pincher, red) after fixation and staining as in Figure 4, except that surface-bound EGF-Alexa555 (blue) was removed by acid-salt wash before fixation, TrkB (green) was seen using anti-TrkB in antibody, and GFP (green) was visualized directly, all as described in Materials and Methods. In B, the axon and growth cone were outlined in the Merge to depict the location of the limiting plasma membrane. Scale bars, 2 μm.
Figure 8.
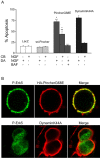
Pincher and dynamin mediate NGF retrograde axonal signaling, but Pincher selectively recruits P-Erk5. A, SCG neurons, cultured in compartmentalized chambers (CB, cell body; DA, distal axon) for 7-9 d, were infected with viruses driving expression of LacZ, HA-Pincher, HA-PincherG68E, or dynaminK44A. The neurons were then subjected to treatment with NGF and/or BAF (caspase inhibitor) for 72 h, as indicated. Infected neurons were visualized by staining for LacZ, HA (Pincher) antibody, and dynamin (K44A) antibody, and apoptosis was assessed as described in Materials and Methods. Values are derived from the average of three independent experiments (error bars indicate SDs). Comparative values were statistically assessed using the M-H test. Comparisons of values between wild-type Pincher (wt-Pincher) and LacZ controls were not statistically significant (p > 0.2). Asterisks indicate comparisons to LacZ with a p < 0.0001. Double asterisks indicate differences among PincherG68E values with p < 0.0001. In the total absence of added NGF, all virally infected neurons (expressing LacZ, wt-Pincher, PincherG68E, or dynaminK44A) died (data not shown). B, SCG neurons cultured in the continuous presence of NGF were infected for 2 d with viruses containing HA-PincherG68E and dynaminK44A. Active P-Erk5 (green), HA-PincherG68E (red; top), and dynaminK44A (red; bottom) were visualized using anti-P-Erk5, anti-HA, and anti-dynamin antibodies, respectively.
Similar articles
- Trk retrograde signaling requires persistent, Pincher-directed endosomes.
Philippidou P, Valdez G, Akmentin W, Bowers WJ, Federoff HJ, Halegoua S. Philippidou P, et al. Proc Natl Acad Sci U S A. 2011 Jan 11;108(2):852-7. doi: 10.1073/pnas.1015981108. Epub 2010 Dec 27. Proc Natl Acad Sci U S A. 2011. PMID: 21187387 Free PMC article. - Pincher, a pinocytic chaperone for nerve growth factor/TrkA signaling endosomes.
Shao Y, Akmentin W, Toledo-Aral JJ, Rosenbaum J, Valdez G, Cabot JB, Hilbush BS, Halegoua S. Shao Y, et al. J Cell Biol. 2002 May 13;157(4):679-91. doi: 10.1083/jcb.200201063. Epub 2002 May 13. J Cell Biol. 2002. PMID: 12011113 Free PMC article. - Axonal targeting of Trk receptors via transcytosis regulates sensitivity to neurotrophin responses.
Ascaño M, Richmond A, Borden P, Kuruvilla R. Ascaño M, et al. J Neurosci. 2009 Sep 16;29(37):11674-85. doi: 10.1523/JNEUROSCI.1542-09.2009. J Neurosci. 2009. PMID: 19759314 Free PMC article. - Endocytosis and endosomes at the crossroads of regulating trafficking of axon outgrowth-modifying receptors.
Winckler B, Yap CC. Winckler B, et al. Traffic. 2011 Sep;12(9):1099-108. doi: 10.1111/j.1600-0854.2011.01213.x. Epub 2011 May 23. Traffic. 2011. PMID: 21535338 Free PMC article. Review. - Biogenesis and function of the NGF/TrkA signaling endosome.
Marlin MC, Li G. Marlin MC, et al. Int Rev Cell Mol Biol. 2015;314:239-57. doi: 10.1016/bs.ircmb.2014.10.002. Epub 2014 Nov 18. Int Rev Cell Mol Biol. 2015. PMID: 25619719 Free PMC article. Review.
Cited by
- Trk activation of the ERK1/2 kinase pathway stimulates intermediate chain phosphorylation and recruits cytoplasmic dynein to signaling endosomes for retrograde axonal transport.
Mitchell DJ, Blasier KR, Jeffery ED, Ross MW, Pullikuth AK, Suo D, Park J, Smiley WR, Lo KW, Shabanowitz J, Deppmann CD, Trinidad JC, Hunt DF, Catling AD, Pfister KK. Mitchell DJ, et al. J Neurosci. 2012 Oct 31;32(44):15495-510. doi: 10.1523/JNEUROSCI.5599-11.2012. J Neurosci. 2012. PMID: 23115187 Free PMC article. - Numb and Alzheimer's disease: the current picture.
Ntelios D, Berninger B, Tzimagiorgis G. Ntelios D, et al. Front Neurosci. 2012 Oct 4;6:145. doi: 10.3389/fnins.2012.00145. eCollection 2012. Front Neurosci. 2012. PMID: 23060745 Free PMC article. - Pharmacologically diverse antidepressants facilitate TRKB receptor activation by disrupting its interaction with the endocytic adaptor complex AP-2.
Fred SM, Laukkanen L, Brunello CA, Vesa L, Göös H, Cardon I, Moliner R, Maritzen T, Varjosalo M, Casarotto PC, Castrén E. Fred SM, et al. J Biol Chem. 2019 Nov 29;294(48):18150-18161. doi: 10.1074/jbc.RA119.008837. Epub 2019 Oct 20. J Biol Chem. 2019. PMID: 31631060 Free PMC article. - The many disguises of the signalling endosome.
Villarroel-Campos D, Schiavo G, Lazo OM. Villarroel-Campos D, et al. FEBS Lett. 2018 Nov;592(21):3615-3632. doi: 10.1002/1873-3468.13235. Epub 2018 Sep 17. FEBS Lett. 2018. PMID: 30176054 Free PMC article. Review. - Essential role for vav Guanine nucleotide exchange factors in brain-derived neurotrophic factor-induced dendritic spine growth and synapse plasticity.
Hale CF, Dietz KC, Varela JA, Wood CB, Zirlin BC, Leverich LS, Greene RW, Cowan CW. Hale CF, et al. J Neurosci. 2011 Aug 31;31(35):12426-36. doi: 10.1523/JNEUROSCI.0685-11.2011. J Neurosci. 2011. PMID: 21880903 Free PMC article.
References
- Beattie EC, Zhou J, Grimes ML, Bunnett NW, Howe CL, Mobley WC (1996) A signaling endosome hypothesis to explain NGF actions: potential implications for neurodegeneration. Cold Spring Harb Symp Quant Biol 61: 389-406. - PubMed
- Bilderback TR, Gazula VR, Lisanti MP, Dobrowsky RT (1999) Caveolin interacts with Trk A and p75(NTR) and regulates neurotrophin signaling pathways. J Biol Chem 274: 257-263. - PubMed
- Campenot RB (1982) Development of sympathetic neurons in compartmentalized cultures. II. Local control of neurite survival by nerve growth factor. Dev Biol 93: 13-21. - PubMed
- Campenot RB, MacInnis BL (2004) Retrograde transport of neurotrophins: fact and function. J Neurobiol 58: 217-229. - PubMed
Publication types
MeSH terms
Substances
LinkOut - more resources
Full Text Sources
Miscellaneous

