Survival adjustment of mature dendritic cells by IL-15 - PubMed (original) (raw)
Comparative Study
. 2005 Jun 14;102(24):8662-7.
doi: 10.1073/pnas.0503360102. Epub 2005 Jun 2.
Affiliations
- PMID: 15932944
- PMCID: PMC1150852
- DOI: 10.1073/pnas.0503360102
Comparative Study
Survival adjustment of mature dendritic cells by IL-15
Sigrid P Dubois et al. Proc Natl Acad Sci U S A. 2005.
Abstract
The survival of CD8+/CD44(hi) memory phenotype T cells depends on an IL-15 activity on nonlymphoid cells. Here, we report that IL-15 and its receptor were induced on dendritic cells (DCs) by a combination of IFN-gamma and NF-kappaB relA inducers. IL-15 conferred in an autocrine loop resistance to apoptosis that accompanied the maturation process in DCs in vitro. As an apparent result in vivo, mice deficient in IL-15 or its receptor harbor few DCs. Injecting DCs into IL-15-/- mice was associated with the appearance of CD8+/CD44(hi) T cells that depended on IL-15 expression but also correlated with the longevity of the DCs. These findings support the hypothesis that DCs mediate the effect of IL-15 on CD8+/CD44(hi) memory phenotype T cells.
Figures
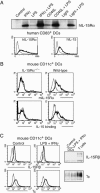
Fig. 1.
Expression of IL-15 and its receptor in DCs. (A) Human blood-derived DCs were grown for 6 days in GM-CSF/IL-4 and stimulated for 24 h as indicated. (Upper) Immunoprecipitation/immunoblot analysis reveals that IL-15Rα was most effectively induced by a combination of 20 ng/ml IFN-γ and 60 ng/ml LPS or 1 μg/ml CD40 ligand. (Lower) FACS analyses showed that human DCs identified by CD83 induced the surface expression of both IL-15Rα and IL-15 in response to LPS/IFN-γ treatment (bold lines). Light lines indicate untreated DCs. (B) Murine DCs were derived from the bone marrow of IL-15Rα-/- (Left) and WT mice (Right) and grown for 6 days in GM-CSF. LPS/IFN-γ treatment induced the expression of IL-15Rα and the binding of human IL-15 on WT DCs (CD11c+) only. (C) Murine DCs express both IL-2/15Rβ and γc at low levels that did not appear to be affected by LPS/IFN-γ treatment as analyzed by FACS (light lines represent isotype controls) and Western blotting.
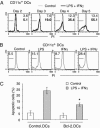
Fig. 2.
Induction of apoptosis in DCs. Murine DCs were derived as described in Fig. 1, stimulated as indicated, and stained with propidium iodide (PI). (A) Treatment of DCs with 60 ng/ml LPS and 20 ng/ml IFN-γ (bold lines) caused the appearance of hypodiploid DNA as a marker of apoptosis that was not observed under control conditions (light lines). (B) Treatment of DCs with LPS or IFN-γ alone caused less apoptotic death than the combination. (C) Overexpression of Bcl-2 protects LPS/IFN-γ-treated DCs from apoptotic death. The asterisk indicates that the difference between Bcl-2-expressing and control DCs proved significant as determined by t test (P < 0.01, n = 4).
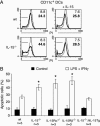
Fig. 3.
Endogenous IL-15 decreases the apoptotic death of DCs in vitro.(A) Murine DCs were derived as described and were either left untreated (light lines and numbers) or stimulated with 60 ng/ml LPS and 20 ng/ml IFN-γ for 4 days (bold lines and numbers). (Left) DNA stains revealed an increased amount of hypodiploid DNA as a late marker of apoptosis if cells had been derived from IL-15-/- mice. (Right) The presence of 1 nM IL-15 in the tissue culture medium reduced apoptotic death in IL-15-/- cells. (B) Average numbers of apoptotic DCs with (open bars) or without (filled bars) LPS/IFN-γ treatment. DCs with deficiencies in IL-15, IL-15Rα, or IL-2/15Rβ showed increased rates of apoptosis after LPS/IFN-γ treatment. The transgenic expression of IL-15 reversed the proapoptotic effect of IL-15 deficiency. *, significant differences when compared with WT samples as determined by t test (P < 0.01).
Fig. 4.
IL-15 is necessary for DCs in vivo. Samples were taken from WT, IL-15-/-, IL-15Rα-/-, and IL-15-/-.hIL-15tg mice and analyzed by FACS. (A) (Upper) Blood samples from IL-15-/- mice contained fewer CD11c+ DCs with a reduction in both the mature (CD86+) and immature compartments. A transgenic expression of human IL-15 on the IL-15-/- background increased the number of DCs. (Lower) The number of DCs correlated with the percentage of circulating CD3+/CD8+/CD44hi T cells. (B) Average numbers of CD11c+ revealed that a lack of IL-15 or IL-15Rα was associated with a stronger reduction of DCs in blood (Left) when compared with spleen (Right) samples. *, significant differences when compared with WT mice based on t test (P < 0.01, n = 5 for each bar).
Fig. 5.
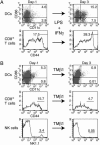
Induced changes in the population size of CD3+/CD8+/CD44hi T cells correlate with the number of DCs. (A) Treatment of WT mice with 5 μg of LPS and 1 μg of IFN-γ leads to an increase of immature DCs (CD11c+/CD86-), mature DCs (CD11c+/CD86+), and CD8+/CD44hi T cells in blood samples 3 days after injection. (B) An injection of 50 μg of TMβ1, an αCD122 (IL-2/15Rβ) antibody that blocks IL-15 signaling, reduced the number of both DCs (CD11c+) and CD3+/CD8+/CD44hi T cells in blood samples. In addition, the antibody injection strongly reduced the number of NK1.1-positive cells. Similar, but less dramatic, changes were observed for all three cell types in spleen and lymph node samples (data not shown).
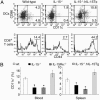
Fig. 6.
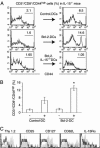
Longevity of DCs affects the number of CD8+/CD44hi T cells in vivo. Murine DCs were derived from bone marrow of Thy1.1-congenic mice, infected with empty or Bcl-2-encoding retroviruses, sorted, matured in 60 ng/ml LPS and 20 ng/ml IFN-γ for 24 h, and injected into the peritoneum of IL-15-/- mice. Blood samples were analyzed 1 day before (Left) and 3 days after (Right) injection. (A) Whereas mock-infected DCs increased the number of CD8+/CD44hi T cells, a stronger increase was observed if Bcl-2-expressing DCs were injected. In contrast, the injection of Bcl-2-expressing IL-15-/- DCs did not affect the number of CD8+/CD44hi T cells. (B) Average numbers of CD8+/CD44hi T cells that were derived from three mice showed a significant effect of the expression of Bcl-2 in WT DCs as determined by t test (P < 0.01). (C) The CD8+/CD44hi T cells originated form host tissues because these cells expressed the congenic marker Thy1.2 of host cells but not Thy1.1 of the injected cells. Further FACS analysis revealed that the Bcl-2-DC-induced CD8+/CD44hi T cells were negative for CD25 (IL-2Rα) and IL-15Rα and positive for CD127 (IL-7Rα). These cells also included a subpopulation that expressed CD62L. Specific antibody staining (gray areas) was compared with isotype controls (thin lines).
Similar articles
- CD44high memory CD8 T cells synergize with CpG DNA to activate dendritic cell IL-12p70 production.
Wong KL, Tang LF, Lew FC, Wong HS, Chua YL, MacAry PA, Kemeny DM. Wong KL, et al. J Immunol. 2009 Jul 1;183(1):41-50. doi: 10.4049/jimmunol.0803473. Epub 2009 Jun 17. J Immunol. 2009. PMID: 19535645 - Complement C5a anaphylatoxin is an innate determinant of dendritic cell-induced Th1 immunity to Mycobacterium bovis BCG infection in mice.
Moulton RA, Mashruwala MA, Smith AK, Lindsey DR, Wetsel RA, Haviland DL, Hunter RL, Jagannath C. Moulton RA, et al. J Leukoc Biol. 2007 Oct;82(4):956-67. doi: 10.1189/jlb.0206119. Epub 2007 Aug 3. J Leukoc Biol. 2007. PMID: 17675563 - Generation of human dendritic cells that simultaneously secrete IL-12 and have migratory capacity by adenoviral gene transfer of hCD40L in combination with IFN-gamma.
Knippertz I, Hesse A, Schunder T, Kämpgen E, Brenner MK, Schuler G, Steinkasserer A, Nettelbeck DM. Knippertz I, et al. J Immunother. 2009 Jun;32(5):524-38. doi: 10.1097/CJI.0b013e3181a28422. J Immunother. 2009. PMID: 19609245 - AsialoGM1+CD8+ central memory-type T cells in unimmunized mice as novel immunomodulator of IFN-gamma-dependent type 1 immunity.
Kosaka A, Wakita D, Matsubara N, Togashi Y, Nishimura S, Kitamura H, Nishimura T. Kosaka A, et al. Int Immunol. 2007 Mar;19(3):249-56. doi: 10.1093/intimm/dxl140. Epub 2007 Jan 17. Int Immunol. 2007. PMID: 17229818 - Critical role for IL-15 in innate immunity.
Ohteki T. Ohteki T. Curr Mol Med. 2002 Jun;2(4):371-80. doi: 10.2174/1566524023362519. Curr Mol Med. 2002. PMID: 12108948 Review.
Cited by
- Effect of Anti-IL-15 Administration on T Cell and NK Cell Homeostasis in Rhesus Macaques.
DeGottardi MQ, Okoye AA, Vaidya M, Talla A, Konfe AL, Reyes MD, Clock JA, Duell DM, Legasse AW, Sabnis A, Park BS, Axthelm MK, Estes JD, Reiman KA, Sekaly RP, Picker LJ. DeGottardi MQ, et al. J Immunol. 2016 Aug 15;197(4):1183-98. doi: 10.4049/jimmunol.1600065. Epub 2016 Jul 18. J Immunol. 2016. PMID: 27430715 Free PMC article. - MTS dye based colorimetric CTLL-2 cell proliferation assay for product release and stability monitoring of interleukin-15: assay qualification, standardization and statistical analysis.
Soman G, Yang X, Jiang H, Giardina S, Vyas V, Mitra G, Yovandich J, Creekmore SP, Waldmann TA, Quiñones O, Alvord WG. Soman G, et al. J Immunol Methods. 2009 Aug 31;348(1-2):83-94. doi: 10.1016/j.jim.2009.07.010. Epub 2009 Jul 30. J Immunol Methods. 2009. PMID: 19646987 Free PMC article. - Interleukin-15 combined with an anti-CD40 antibody provides enhanced therapeutic efficacy for murine models of colon cancer.
Zhang M, Yao Z, Dubois S, Ju W, Müller JR, Waldmann TA. Zhang M, et al. Proc Natl Acad Sci U S A. 2009 May 5;106(18):7513-8. doi: 10.1073/pnas.0902637106. Epub 2009 Apr 21. Proc Natl Acad Sci U S A. 2009. PMID: 19383782 Free PMC article. - IL-15 synergizes with CD40 agonist antibodies to induce durable immunity against bladder cancer.
Wong JL, Smith P, Angulo-Lozano J, Ranti D, Bochner BH, Sfakianos JP, Horowitz A, Ravetch JV, Knorr DA. Wong JL, et al. Proc Natl Acad Sci U S A. 2023 Aug 29;120(35):e2306782120. doi: 10.1073/pnas.2306782120. Epub 2023 Aug 22. Proc Natl Acad Sci U S A. 2023. PMID: 37607227 Free PMC article. - Tumour-retained activated CCR7+ dendritic cells are heterogeneous and regulate local anti-tumour cytolytic activity.
Lee CYC, Kennedy BC, Richoz N, Dean I, Tuong ZK, Gaspal F, Li Z, Willis C, Hasegawa T, Whiteside SK, Posner DA, Carlesso G, Hammond SA, Dovedi SJ, Roychoudhuri R, Withers DR, Clatworthy MR. Lee CYC, et al. Nat Commun. 2024 Jan 24;15(1):682. doi: 10.1038/s41467-024-44787-1. Nat Commun. 2024. PMID: 38267413 Free PMC article.
References
- Sprent, J. (2003) Microbes Infect. 5, 227-231. - PubMed
- Schluns, K. S. & Lefrancois, L. (2003) Nat. Rev. Immunol. 3, 269-279. - PubMed
- Waldmann, T. A., Dubois, S. & Tagaya, Y. (2001) Immunity 14, 105-110. - PubMed
- Lodolce, J., Burkett, P., Koka, R., Boone, D., Chien, M., Chan, F., Madonia, M., Chai, S. & Ma, A. (2002) Mol. Immunol. 39, 537-544. - PubMed
- Grabstein, K. H., Eisenman, J., Shanebeck, K., Rauch, C., Srinivasan, S., Fung, V., Beers, C., Richardson, J., Schoenborn, M. A. & Ahdieh, M. (1994) Science 264, 965-968. - PubMed
Publication types
MeSH terms
Substances
LinkOut - more resources
Full Text Sources
Molecular Biology Databases
Research Materials
Miscellaneous
