Regulation of microtubule severing by katanin subunits during neuronal development - PubMed (original) (raw)
Regulation of microtubule severing by katanin subunits during neuronal development
Wenqian Yu et al. J Neurosci. 2005.
Abstract
Katanin, the microtubule-severing protein, consists of a subunit termed P60 that breaks the lattice of the microtubule and another subunit termed P80, the functions of which are not well understood. Data presented here show that the ratio of P60 to P80 varies markedly in different tissues, at different phases of development, and regionally within the neuron. P80 is more concentrated in the cell body and less variable during development, whereas P60 often shows concentrations in the distal tips of processes as well as dramatic spikes in expression at certain developmental stages. Overexpression of P60 at various stages in the differentiation of cultured hippocampal neurons results in substantial loss of microtubule mass and a diminution in total process length. In comparison, overexpression of P80, which is thought to augment the severing of microtubules by P60, results in a milder loss of microtubule mass and diminution in process length. At the developmental stage corresponding to axogenesis, overexpression of P60 decreases the total number of processes extended by the neuron, whereas overexpression of P80 produces the opposite result, suggesting that the effects on neuronal morphology are dependent on the degree of microtubule severing and loss of polymer. The microtubules that occupy the axon are notably more resistant to depolymerization in response to excess P60 or P80 than microtubules elsewhere in the neuron, suggesting that regional differences in the susceptibility of microtubules to severing proteins may be a critical factor in the generation and maintenance of neuronal polarity.
Figures
Figure 1.
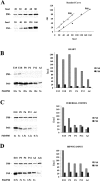
Biochemical determination of the ratio of P60 to P80 katanin. A, Calibration of anti-P60 and anti-P80 antibodies. Standard curves were obtained using 20-160 fmol of P60 or 20-80 fmol of P80 katanin. B-D, Concentration of P80 and P60 katanin in developing rat tissues. Tissues were collected and combined from 12 E15 and 12 E18 rats, six to eight P0 or P6 rats, and four to six P12 and adult (Ad) rats. Protein extracts from 1000 μg of combined tissues from different developmental stages were prepared in sample buffer. One-half of the extract was used for Western blot analysis with anti-P80 antibody, and the other half was used simultaneously for Western blot analysis with anti-P60 antibody. The optical densities were measured for bands corresponding to full-length P80 and P60 katanin, and protein concentrations were read from standard curves. Each bar in B-D represents the average amount of katanin found in tissue from 4-12 animals. P60/P80 ratios were calculated by dividing P80 concentration (in fmol) by P60 concentration (in fmol). B, Concentration of P80 and P60 katanin in developing rat heart. C, Concentration of P80 and P60 katanin in developing rat cerebral cortex. D, Concentration of P80 and P60 katanin in developing rat hippocampus. Even when total protein concentration in the adult cerebral cortex sample (Adc) was two times higher than in the adult hippocampus sample (Ad), the P60 concentration was still clearly higher in the hippocampus.
Figure 2.
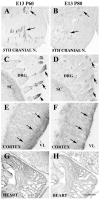
Expression of P60 and P80 katanin in neuronal and non-neuronal tissues. A, C, E, G, E13 mouse sections immunolabeled for P60 katanin. B, D, F, H, E13 mouse sections immunolabeled for P80 katanin. A, High levels of P60 katanin are present along the lengths of axons exiting the fifth cranial nerve (arrows). B, Expression of P80 katanin in axons exiting the fifth cranial nerve is considerably lower than that of P60 katanin (arrows). C, P60 katanin expression is abundant in peripheral processes (arrows) of DRG sensory neurons. D, The same processes of DRG sensory neurons express P80 katanin (arrows) but at a significantly lower level. E, At E13 in the developing cerebral cortex, high levels of P60 katanin are present only in cells and processes near the lateral ventricle (arrows). Labeled cells are radial glia or recently born neurons. F, P80 katanin is also present mostly in cells near the ventricle in E13 cortex (arrows). G, H, In E13 heart, both P60 and P80 katanin are more uniformly distributed in developing cardiac muscle cells. Scale bar: A-D, G-H, 230 μm; E, F, 115 μm. 5TH CRANIAL N., Fifth cranial nerve; VL, lateral ventricle; SC, spinal cord.
Figure 3.
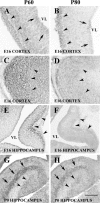
Expression of P60 and P80 katanin in the cerebral cortex and hippocampus. A, C, E, E16 mouse cerebral cortex sections (A, C) and an E16 mouse hippocampus section (E) immunolabeled for P60 katanin. B, D, F, E16 mouse cerebral cortex sections (B, D) and an E16 hippocampus section (F) immunolabeled for P80 katanin. G, P0 hippocampus section in situ hybridized with a riboprobe specific for P60 katanin. H, P0 hippocampus section in situ hybridized with a riboprobe specific for P80 katanin. A, By E16, P60 is detectably expressed in cells adjacent to the ventricle (arrows) but also in cells far from ventricular zones, which are postmigratory neurons of the early cortical plate (arrowheads). B, P80 expression is very weak in cells adjacent to ventricle (arrows) but is clearly detectible in cells that have migrated toward the pia (arrowheads). C, D, The P60 and P80 expression, respectively, is elevated in these sections within superficial layers of the E16 cerebral cortex, where the postmigratory neurons are localized. E, F, P60 katanin expression and P80 expression in E18 hippocampus is also high in early postmigratory neurons (arrowheads). G, H, At postnatal day 1 (P0), both P60 and P80 are highly expressed in layers containing hippocampal neurons, including the dentate gyrus (arrowheads) and Ammon's horn (arrows). Scale bar: A-D, G, H, 230 μm; E, F, 115 μm. VL, Lateral ventricle.
Figure 4.
Comparison of P60 and P80 katanin expression patterns in developing cultured hippocampal neurons. Microtubule staining (β-tubulin) is shown in red, and katanin staining is shown in green. The top row shows P60 katanin (A-D), and the bottom row shows P80 katanin (E-H). P60 and P80 are both present throughout all compartments of the neuron; processes that appear red-orange have lower levels of katanin, whereas processes that appear green have higher levels of katanin. A, E, Neurons in stage 2/3 before dendritogenesis. B, C, F, G, Neurons in early stage 4 (arrows). D, H, Neurons in late stage 4. Note that P80 is more concentrated in cell bodies compared with P60. Note that P60 levels are dramatically higher during early stage 4 compared with earlier and later developmental stages. No such spike in expression is observed with P80. Scale bar, 80 μm.
Figure 5.
Quantification of endogenous P60 and P80 katanin levels in cell bodies, processes, and tips of processes of cultured hippocampal neurons at different developmental stages. A-D, Neurons in early stage 4. Microtubule staining (β-tubulin) is shown in red, and katanin staining is shown in green. A, B, P60 katanin. C, D, P80 katanin. Arrowheads point to growth cones, which are notably enriched for P60 but not P80. A and C are lower magnification and B and D are higher magnification of the tip regions (growth cone) of axons. The arrows point to branch points, which were also somewhat enriched for P60 but not P80. Quantification of data obtained from various types of processes and various regions of the neuron are shown in E-J. Data (_y_-axis) are expressed as the ratio of P60 or P80 obtained with each antibody to β-tubulin calculated using AFUs. Absolute levels of P60 and P80 cannot be compared with this approach. Note that the two subunits of katanin do not show identical changes in the various compartments (see Fig. 4). Stages of development [as defined by Dotti et al. (1988)] are shown as roman numerals in these graphs. There is a gradual increase in P80 levels within the cell body as the neuron transitions into early and late stage 4 (1.6-2.1 times compared with stage 1; p < 0.001). Compared with stage 3 axons, the levels of P80 in early and late stage 4 axons only increased by 1.36-1.5 times (_p_ < 0.05). In late dendrites, the levels are approximately triple those in the early immature processes (_p_ < 0.001). With regard to P60, there is a sharp increase in early stage 4 cell bodies, axons (∼2.5 times; _p_ < 0.001), and dendrites (∼2.25 times; _p_ < 0.001) compared with stage 1. The levels of P60 came down in the late stage 4 cell bodies (1.8 times; _p_ < 0.001), axons (1.25 times; _p_ < 0.05), and dendrites (_p_ > 0.05) compared with stage 1. At all developmental stages, there is more P80 at the tips of the processes compared with the processes themselves (1.6-2.5 times; p < 0.01). With regard to P60, there is no significant difference between the tips and the shafts in the immature processes and the stage 3 axons (_p_ > 0.05), but there is a very dramatic enrichment at the tips of both axons and dendrites in early stage 4 (3-6 times; p < 0.0001). Scale bar: A, C, 30 μm; B, D, 50 μm.
Figure 6.
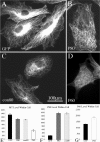
Effects of katanin constructs on microtubule levels in fibroblasts. A-D, Immunostaining of microtubules in RFL6 cells overexpressing EGFP, katanin P80, con80, or P60. E-G, Quantification of the data on microtubule levels and katanin (P80 and P60) levels. P80 and con80 resulted in partial but not dramatic loss of microtubule mass (decreased by 18 and 16%, respectively; p < 0.01) (B, C, E), even when expressed at high levels (∼5 times more than control; p < 0.001) (F). P60, in contrast, caused much greater severing and loss of microtubule mass (reduced by 63%; p < 0.001), even when expressed at much lower levels (28% increase; p < 0.01). Notably, P80 and con80, although not dramatically reducing microtubule levels, resulted in a loss of the tight concentration of microtubules in the centrosomal region (B, C). All of the microtubules in the cells overexpressing P60 are relatively short (a few micrometers in length), whereas the cells overexpressing P80 or con80 still display many long microtubules. Data (_y_-axis) are expressed in AFUs. Scale bar, 100 μm.
Figure 7.
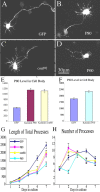
Quantitative analyses of process number and length on cultured hippocampal neurons at different developmental stages overexpressing katanin P80, con80, and P60. A-D, Immunostaining of EGFP for the cells that were transfected with the various constructs using EGFP as the tag. These cells were plated for 1 d, transfected, and allowed to express for 1 d. E-H, Quantification of data on the levels of katanin P80, con80, and P60 in the cell body, on process length, and on process number in hippocampal cultures at various days after plating, induced to express EGFP, P80-katanin, P60-katanin, or con80. The constructs were expressed for only 1 d after various days in culture. Day 1 refers to cells that were transfected before plating. Note that day 2 represents a particularly sensitive developmental stage with regard to process number. The P60 construct diminishes process number, whereas the P80 constructs increase process number (A-D, H) (p < 0.05 between control and P80/con80; _p_ < 0.0001 for control and P60). With regard to the length of the processes, P80 and P60 overexpression decreased total process length by 30 and 50%, respectively (_p_ < 0.01). Day 4 is sensitive in terms of process number and length, with all constructs diminishing both (_p_ < 0.01). The number of days in culture is shown on the _x_-axis. The _y_-axis shows the total length of all of the processes extended by the neuron in micrometers (_n_ > 20). At all time points, overexpression of P80 and con80 increases the protein level within the cell body by 2.3 times, whereas P60 increases total levels by ∼33% (E, F) (_y_-axis is in AFUs). Scale bar, 30 μm.
Figure 8.
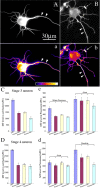
Quantitative analyses of microtubule levels in different regions of cultured hippocampal neurons overexpressing P80, con80, and P60. Aa and Bb are microtubule immunostainings of late stage 3 hippocampal neurons. a and b are the glow-scale pseudocolored images, with white indicating the highest level and purple indicating the lowest level (see color-coded bar). Aa shows a control neuron expressing EGFP, and Bb shows a neuron overexpressing P60 katanin. Arrowheads point to the axon, and small arrows indicate twisted microtubules that are sometimes observed in neurons overexpressing P80, con80, or P60 (note also the bright structure in the top left of B and D; (this is a small bundle of these contorted microtubules). Note that the axon shows no diminution in fluorescence intensity as a result of P60 overexpression, whereas the cell body and immature (“minor”) processes are dimmer. Cc shows the quantification of microtubule mass in stage 3 neurons. Overexpression of the various katanin constructs in stage 3 neurons resulted in a 30-58% decrease in microtubule levels in cell bodies and minor processes (p < 0.01). In axons, overexpression of P80 or con80 did not cause any microtubule diminution (no significant difference; _p_ > 0.05), but overexpression of P60 caused a 20% loss of microtubules (p < 0.01). **_Dd_** shows the quantification of microtubule mass in stage 4 neurons. Overexpression of the various katanin constructs caused microtubule levels in the cell bodies to decrease by 44-50% (_p_ < 0.01), which is similar to the results obtained from the cell bodies of stage 3 neurons. In the stage 4 axons, like stage 3 axons, P80 or con80 did not cause any microtubule diminution (_p_ > 0.05). However, at stage 4, there was also no diminution in microtubule levels in axons resulting from expression of the P60 construct (p > 0.05). In dendrites, there were 20 and 23% diminution in microtubule levels as a result of P80 and con80, respectively, and a 44% diminution in microtubule levels as a result of the P60 construct (p < 0.05). Scale bar, 30 μm.
Similar articles
- Axonal growth is sensitive to the levels of katanin, a protein that severs microtubules.
Karabay A, Yu W, Solowska JM, Baird DH, Baas PW. Karabay A, et al. J Neurosci. 2004 Jun 23;24(25):5778-88. doi: 10.1523/JNEUROSCI.1382-04.2004. J Neurosci. 2004. PMID: 15215300 Free PMC article. - Production and characterization of a monoclonal antibody against P60-katanin.
Akkor M, Karabay A. Akkor M, et al. Hybridoma (Larchmt). 2010 Dec;29(6):531-7. doi: 10.1089/hyb.2010.0050. Epub 2010 Dec 6. Hybridoma (Larchmt). 2010. PMID: 21133804 - The microtubule-severing proteins spastin and katanin participate differently in the formation of axonal branches.
Yu W, Qiang L, Solowska JM, Karabay A, Korulu S, Baas PW. Yu W, et al. Mol Biol Cell. 2008 Apr;19(4):1485-98. doi: 10.1091/mbc.e07-09-0878. Epub 2008 Jan 30. Mol Biol Cell. 2008. PMID: 18234839 Free PMC article. - Microtubule severing.
Quarmby LM, Lohret TA. Quarmby LM, et al. Cell Motil Cytoskeleton. 1999;43(1):1-9. doi: 10.1002/(SICI)1097-0169(1999)43:1<1::AID-CM1>3.0.CO;2-#. Cell Motil Cytoskeleton. 1999. PMID: 10340698 Review. - Finding a right place to cut: How katanin is targeted to cellular severing sites.
Nakamura M, Yagi N, Hashimoto T. Nakamura M, et al. Quant Plant Biol. 2022 Apr 11;3:e8. doi: 10.1017/qpb.2022.2. eCollection 2022. Quant Plant Biol. 2022. PMID: 37077970 Free PMC article. Review.
Cited by
- A conceptual view at microtubule plus end dynamics in neuronal axons.
Voelzmann A, Hahn I, Pearce SP, Sánchez-Soriano N, Prokop A. Voelzmann A, et al. Brain Res Bull. 2016 Sep;126(Pt 3):226-237. doi: 10.1016/j.brainresbull.2016.08.006. Epub 2016 Aug 12. Brain Res Bull. 2016. PMID: 27530065 Free PMC article. Review. - Using publicly available transcriptomic data to identify mechanistic and diagnostic biomarkers in azoospermia and overall male infertility.
Omolaoye TS, Hachim MY, du Plessis SS. Omolaoye TS, et al. Sci Rep. 2022 Feb 16;12(1):2584. doi: 10.1038/s41598-022-06476-1. Sci Rep. 2022. PMID: 35173218 Free PMC article. - Elk1 affects katanin and spastin proteins via differential transcriptional and post-transcriptional regulations.
Kelle D, Kırımtay K, Selçuk E, Karabay A. Kelle D, et al. PLoS One. 2019 Feb 21;14(2):e0212518. doi: 10.1371/journal.pone.0212518. eCollection 2019. PLoS One. 2019. PMID: 30789974 Free PMC article. - An essential role for katanin p80 and microtubule severing in male gamete production.
O'Donnell L, Rhodes D, Smith SJ, Merriner DJ, Clark BJ, Borg C, Whittle B, O'Connor AE, Smith LB, McNally FJ, de Kretser DM, Goodnow CC, Ormandy CJ, Jamsai D, O'Bryan MK. O'Donnell L, et al. PLoS Genet. 2012;8(5):e1002698. doi: 10.1371/journal.pgen.1002698. Epub 2012 May 24. PLoS Genet. 2012. PMID: 22654669 Free PMC article. - Basic fibroblast growth factor elicits formation of interstitial axonal branches via enhanced severing of microtubules.
Qiang L, Yu W, Liu M, Solowska JM, Baas PW. Qiang L, et al. Mol Biol Cell. 2010 Jan 15;21(2):334-44. doi: 10.1091/mbc.e09-09-0834. Epub 2009 Nov 25. Mol Biol Cell. 2010. PMID: 19940015 Free PMC article.
References
- Avila J, Dominguez J, Diaz-Nido J (1994) Regulation of microtubule dynamics by microtubule-associated protein expression and phosphorylation during neuronal development. Int J Dev Biol 38: 13-25. - PubMed
- Baas PW, Buster DW (2004) Slow axonal transport and the genesis of neuronal morphology. J Neurobiol 58: 3-17. - PubMed
- Baas PW, Qiang L (2005) Neuronal microtubules: when the MAP is the roadblock. Trends Cell Biol 15: 183-187. - PubMed
- Buster DW, Baird DH, Yu W, Solowska JM, Chauviere M, Mazurek A, Kress M, Baas PW (2003) Expression of the mitotic kinesin Kif15 in postmitotic neurons: implications for neuronal migration and development. J Neurocytol 32: 79-96. - PubMed
Publication types
MeSH terms
Substances
LinkOut - more resources
Full Text Sources
Molecular Biology Databases
Research Materials
