Whole-genome transcription profiling of rhesus monkey rhadinovirus - PubMed (original) (raw)
Whole-genome transcription profiling of rhesus monkey rhadinovirus
Dirk P Dittmer et al. J Virol. 2005 Jul.
Abstract
Rhesus monkey rhadinovirus (RRV) and Kaposi's sarcoma-associated herpesvirus (KSHV; also called human herpesvirus 8) belong to the gamma-2 grouping of herpesviruses. RRV and KSHV share a high degree of sequence similarity, and their genomes are organized in a similar fashion. RRV serves as an excellent animal model system to study the gamma herpesvirus life cycle both in vitro and in vivo. We have developed a high-sensitivity, high-throughput, high-specificity real-time quantitative reverse transcriptase-based PCR assay for RRV and have used this assay to profile transcription from the whole RRV genome during de novo productive infection of rhesus fibroblasts. Using this assay, we demonstrate that the genome-wide transcription profile for RRV closely parallels the genome-wide transcription profile for KSHV.
Figures
FIG. 1.
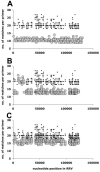
RRV primer design and characteristics. Shown on the vertical axes are the numbers of nucleotide matches for each of the 568 primers in the initial RRV array, which contained three primers per ORF. On the horizontal axes, the nucleotide positions for each primer start site on the RRV genome (26-95) are indicated. In all three panels, A, B, and C, the small black dots represent the intended primer and numbered matches, which equals the primer length. In panel A, the large gray circles represent the second closest match for a given primer on the RRV genome. In panel B, the large gray circles represent the highest match for a given primer on any herpesvirus nucleotide sequence in the NCBI GenBank database, except RRV. In panel C, the large gray circles represent the highest match for a given primer on the human genome.
FIG. 2.
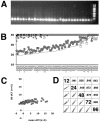
Quality control of the RRV RT-PCR array. (A) Agarose gel of a subset of PCR products after amplification of RRV virion DNA with primers in the RRV array. A 100-bp molecular weight marker is shown on the right. (B) Raw CT values after real-time QPCR using the following input samples: (i) water as an NTC (open squares); (ii) RNA from uninfected cells that was DNase I treated, reverse transcribed, and RNase H treated (gray circles); (iii) RNA from uninfected cells that was DNase I treated but prepared without reverse transcriptase in the cDNA reaction and subjected to RNase H digestion (gray squares); and (iv) RRV virion DNA (gray line). (C) RhFs were infected with RRV at five different time points (n = 5), 12, 24, 48, 72, and 96 h. mRNAs were harvested and subjected to real-time RT-PCR. The dCT values of RRV mRNAs were normalized to that of rhesus tubulin. Panel C is a graph representing the SD of the dCT values (vertical axis) versus the mean dCT val ues (horizontal axis). Lower dCT values correspond to higher levels of mRNA on a log2 scale (dCT). (D) Scatter plot matrix of raw CT data for each time point after productive infection of RhFs with RRV depicted as a diagonal line. Also shown is the correlation coefficient for each pair of datum sets.
FIG. 3.
Whole-genome profiling of RRV transcripts following de novo infection of RhFs. (A) Shown is a heat map representation of real-time QPCR data normalized to rhesus tubulin (dCT) at 0, 12, 24, 48, 72, and 96 h postinfection of permissive RhFs. Black indicates low, yellow represents intermediate, and red represents the highest level of viral mRNA detected. Panel A shows the result of rank ordering using a euclidian matrix. (B) Result of rank ordering using the scalar product of mRNA levels normalized to rhesus tubulin.
FIG. 4.
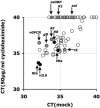
Impact of cycloheximide on RRV transcription. RhFs were pretreated with 50 μg/ml cycloheximide for 1 h, infected with RRV at an MOI of 1, and maintained in cycloheximide until the end of the experiment. Plotted are the CT values for all RRV mRNAs in the array at 6 h after infection in the presence (vertical axis) or absence (horizontal axis) of cycloheximide. Black circles represent mRNAs that are immediate-early genes in KSHV, gray circles represent genes that are known transcriptional targets of ORF50/Rta, and open circles represent all other RRV mRNAs.
FIG. 5.
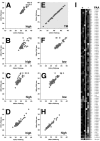
Impact of cycloheximide and PAA on RRV transcription. RhFs were infected with RRV at an MOI of 1 (panels A to D and H) or an MOI of 0.1 (panels F and G) and either not treated or treated with 50 μM PAA. Plotted are the CT values for all RRV mRNAs in infected RhFs at 12, 24, 48, 72, and 96 h after infection. Data from RRV-infected, mock-treated cells are on the horizontal axis and data from RRV-infected, PAA-treated cells are plotted on the vertical axis. Panel E plots the melting curves of the reaction products for all RRV primers at 24 h after infection for RRV-infected, PAA-treated (vertical) and RRV-infected, untreated cells. Panel I shows standard correlation-based, hierarchical clustering of time points 12, 24, and 48 h in the presence or absence of PAA. Black indicates low and gray/white high relative levels of the corresponding viral mRNAs. pos, positive; neg, negative.
FIG. 6.
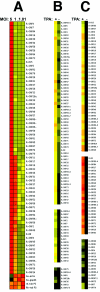
Applications of the RRV real-time QPCR array. (A) RhFs were infected with RRV at different MOIs (5, 1, 0.1, and 0.01). The real-time QPCR data were normalized to rhesus tubulin (dCT) at 48 h postinfection and are depicted as a heat map. Black indicates low, gray indicates intermediate, and white indicates the highest level of viral mRNA transcripts detected at the different MOIs. (B) Profiles of RRV-infected latent HEK293 cells with and without TPA induction.Cells were treated with TPA or dimethyl sulfoxide for 48 h. Total RNA was isolated and subjected to real-time PCR. The data were normalized to tubulin (dCT). Data are depicted as a heat map using euclidian (B) or standard correlation (C) clustering. Black indicates low, yellow indicates intermediate, and red indicates the highest relative level of viral mRNA transcripts.
FIG. 7.
Locations of RRV primers relative to predicted mRNA termination signals in the RRV genome. Depicted is the location of the forward primer for each RRV ORF (squares) on the RRV genome. Primers for rightward ORFs are indicated as boxes above the horizontal line, and primers for leftward ORFs are indicated below the genome axis. The sequential ORFs (either rightward or leftward) amplified by these primers are connected by vertical lines. The predicted termination signals are indicated with dots.
Similar articles
- Construction of an infectious rhesus rhadinovirus bacterial artificial chromosome for the analysis of Kaposi's sarcoma-associated herpesvirus-related disease development.
Estep RD, Powers MF, Yen BK, Li H, Wong SW. Estep RD, et al. J Virol. 2007 Mar;81(6):2957-69. doi: 10.1128/JVI.01997-06. Epub 2007 Jan 10. J Virol. 2007. PMID: 17215283 Free PMC article. - Complete genome sequence of Pig-tailed macaque rhadinovirus 2 and its evolutionary relationship with rhesus macaque rhadinovirus and human herpesvirus 8/Kaposi's sarcoma-associated herpesvirus.
Bruce AG, Thouless ME, Haines AS, Pallen MJ, Grundhoff A, Rose TM. Bruce AG, et al. J Virol. 2015 Apr;89(7):3888-909. doi: 10.1128/JVI.03597-14. Epub 2015 Jan 21. J Virol. 2015. PMID: 25609822 Free PMC article. - Rhesus monkey rhadinovirus (RRV): construction of a RRV-GFP recombinant virus and development of assays to assess viral replication.
DeWire SM, Money ES, Krall SP, Damania B. DeWire SM, et al. Virology. 2003 Jul 20;312(1):122-34. doi: 10.1016/s0042-6822(03)00195-8. Virology. 2003. PMID: 12890626 - Rhesus monkey rhadinovirus: a model for the study of KSHV.
O'Connor CM, Kedes DH. O'Connor CM, et al. Curr Top Microbiol Immunol. 2007;312:43-69. doi: 10.1007/978-3-540-34344-8_2. Curr Top Microbiol Immunol. 2007. PMID: 17089793 Review. - Rhesus macaque rhadinovirus-associated disease.
Estep RD, Wong SW. Estep RD, et al. Curr Opin Virol. 2013 Jun;3(3):245-50. doi: 10.1016/j.coviro.2013.05.016. Epub 2013 Jun 6. Curr Opin Virol. 2013. PMID: 23747119 Free PMC article. Review.
Cited by
- Genome-wide real-time PCR for West Nile virus reduces the false-negative rate and facilitates new strain discovery.
Papin JF, Vahrson W, Larson L, Dittmer DP. Papin JF, et al. J Virol Methods. 2010 Oct;169(1):103-11. doi: 10.1016/j.jviromet.2010.07.005. Epub 2010 Jul 14. J Virol Methods. 2010. PMID: 20637239 Free PMC article. - Maturation and vesicle-mediated egress of primate gammaherpesvirus rhesus monkey rhadinovirus require inner tegument protein ORF52.
Anderson MS, Loftus MS, Kedes DH. Anderson MS, et al. J Virol. 2014 Aug;88(16):9111-28. doi: 10.1128/JVI.01502-14. Epub 2014 Jun 4. J Virol. 2014. PMID: 24899183 Free PMC article. - Genome-wide characterization of the Pectate Lyase-like (PLL) genes in Brassica rapa.
Jiang J, Yao L, Miao Y, Cao J. Jiang J, et al. Mol Genet Genomics. 2013 Nov;288(11):601-14. doi: 10.1007/s00438-013-0775-3. Epub 2013 Sep 3. Mol Genet Genomics. 2013. PMID: 23999922 - A Conserved Leucine Zipper Motif in Gammaherpesvirus ORF52 Is Critical for Distinct Microtubule Rearrangements.
Loftus MS, Verville N, Kedes DH. Loftus MS, et al. J Virol. 2017 Aug 10;91(17):e00304-17. doi: 10.1128/JVI.00304-17. Print 2017 Sep 1. J Virol. 2017. PMID: 28615210 Free PMC article. - Prevalence of viremia and oral shedding of rhesus rhadinovirus and retroperitoneal fibromatosis herpesvirus in large age-structured breeding groups of rhesus macaques (Macaca mulatta).
White JA, Todd PA, Yee JL, Kalman-Bowlus A, Rodgers KS, Yang X, Wong SW, Barry P, Lerche NW. White JA, et al. Comp Med. 2009 Aug;59(4):383-90. Comp Med. 2009. PMID: 19712580 Free PMC article.
References
- Ballestas, M. E., P. A. Chatis, and K. M. Kaye. 1999. Efficient persistence of extrachromosomal KSHV DNA mediated by latency-associated nuclear antigen. Science 284:641-644. - PubMed
- Calderwood, M. A., K. T. Hall, D. A. Matthews, and A. Whitehouse. 2004. The herpesvirus saimiri ORF73 gene product interacts with host-cell mitotic chromosomes and self-associates via its C terminus. J. Gen. Virol. 85:147-153. - PubMed
- Cesarman, E., Y. Chang, P. S. Moore, J. W. Said, and D. M. Knowles. 1995. Kaposi's sarcoma-associated herpesvirus-like DNA sequences in AIDS-related body-cavity-based lymphomas. N. Engl. J. Med. 332:1186-1191. - PubMed
- Chan, S. R., C. Bloomer, and B. Chandran. 1998. Identification and characterization of human herpesvirus-8 lytic cycle-associated ORF 59 protein and the encoding cDNA by monoclonal antibody. Virology 240:118-126. - PubMed
Publication types
MeSH terms
Substances
Grants and funding
- AI58093/AI/NIAID NIH HHS/United States
- R01 CA109232/CA/NCI NIH HHS/United States
- R03 AI058093/AI/NIAID NIH HHS/United States
- CA096500-S/CA/NCI NIH HHS/United States
- CA096500/CA/NCI NIH HHS/United States
- CA109232/CA/NCI NIH HHS/United States
- R01 CA096500/CA/NCI NIH HHS/United States
LinkOut - more resources
Full Text Sources
