Actin depolymerization disrupts tight junctions via caveolae-mediated endocytosis - PubMed (original) (raw)
Actin depolymerization disrupts tight junctions via caveolae-mediated endocytosis
Le Shen et al. Mol Biol Cell. 2005 Sep.
Abstract
The tight junction (TJ) determines epithelial barrier function. Actin depolymerization disrupts TJ structure and barrier function, but the mechanisms of this effect remain poorly understood. The goal of this study was to define these mechanisms. Madin-Darby canine kidney (MDCK) cells expressing enhanced green fluorescent protein-, enhanced yellow fluorescent protein-, or monomeric red fluorescent protein 1-fusion proteins of beta-actin, occludin, claudin-1, ZO-1, clathrin light chain A1, and caveolin-1 were imaged by time-lapse multidimensional fluorescence microscopy with simultaneous measurement of transepithelial electrical resistance (TER). Actin depolymerization was induced with latrunculin A (LatA). Within minutes of LatA addition TER began to fall. This coincided with occludin redistribution and internalization. In contrast, ZO-1 and claudin-1 redistribution occurred well after maximal TER loss. Occludin internalization and TER loss, but not actin depolymerization, were blocked at 14 degrees C, suggesting that membrane traffic is required for both events. Inhibition of membrane traffic with 0.4 M sucrose also blocked occludin internalization and TER loss. Internalized occludin colocalized with caveolin-1 and dynamin II, but not with clathrin, and internalization was blocked by dominant negative dynamin II (K44A), but not by Eps15Delta95-295 expression. Inhibition of caveolae-mediated endocytosis by cholesterol extraction prevented both LatA-induced TER loss and occludin internalization. Thus, LatA-induced actin depolymerization causes TJ structural and functional disruption by mechanisms that include caveolae-mediated endocytosis of TJ components.
Figures
Figure 1.
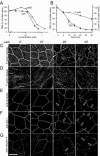
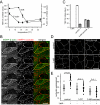
LatA-induces functional and structural TJ disruption. (A) MDCK monolayers were treated with indicated concentrations of LatA or cytochalasin D (cytoD). TER is shown 30 min after drug addition. Low doses of cytochalasin D increased TER, whereas higher doses reduced TER. LatA only caused dose-dependent TER loss. (B) TER loss parallels F-actin loss after LatA addition. Monolayers were treated with 0.5 μM LatA for indicated times. (C–G) LatA causes progressive disruption of F-actin and TJ proteins. Monolayers were treated with 0.5 μM LatA for indicated times, fixed, and stained with phalloidin to detect F-actin (C and D). Images at the level of the TJ (C) and basal stress fibers (D) are shown. Progressive loss of apical actin with partial fragmentation of the perijunctional actin ring (arrows) is apparent at 20 min. Basal stress fiber density also decreased beginning 20 min after LatA addition. LatA treatment induced discontinuities (arrows) in TJ distribution of occludin (E), ZO-1 (F), and claudin-4 (G) that were first detectable after 20 min. Bar, 10 μm.
Figure 2.
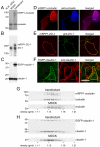
Expression of fluorescent tagged tight junction proteins in MDCK monolayers. (A–C) Lysates of nontransfected (MDCK) and stably transfected (transfectant) MDCK cells expressing mRFP1-occludin (A), mRFP-ZO-1 (B), and EGFP-claudin-1 (C) were studied by immunoblot. Fusion protein expression is less than or equal to endogenous expression for each protein. (D–F) Monolayers of stably-transfected MDCK cells expressing mRFP1-occludin (D), mRFP-ZO-1 (E), and EGFP-claudin-1 (F) were fixed and immunostained for the corresponding endogenous protein. Fusion proteins (left) colocalized with endogenous proteins (middle) in all cases. (G and H) Lysates of nontransfected (MDCK) and stably transfected (transfectant) monolayers expressing mRFP1-occludin (G) or EGFP-claudin-1 (H) were separated on isopycnic sucrose gradients. Fractions were analyzed by SDS-PAGE and immunoblot. Fusion proteins are found in the same fractions as endogenous proteins, both in stable transfectants and when compared with nontransfected cells.
Figure 3.
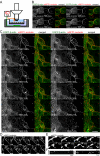
Live cell imaging during LatA treatment allows identification of morphological events that correlate with TER loss. (A) Experimental apparatus. MDCK monolayers grown on 24-mm-diameter Transwells are mounted over a modified 35-mm-diameter culture dish in a temperature-controlled stage (set to 37°C unless noted otherwise). An aqueous immersion objective images the monolayer from the apical media. Ag-AgCl electrodes on both sides of the monolayer are linked to an EVOM to measure TER. (B) Confluent monolayers stably expressing EGFP-β-actin (left) and mRFP1-occludin (middle) were imaged as z-stacks at 1-min intervals for 30 min. As is typical for transgenes expressed in MDCK, fusion protein expression, i.e., fluorescent intensity, varies between cells. A single z-plane at the level of the TJ is shown. Both TER and localization of EGFP-β-actin and mRFP1-occludin were stable over this period. Bar, 20 μm. (C) Confluent monolayers stably expressing EGFP-β-actin (left) and mRFP1-occludin (middle) were imaged as z-stacks at 1-min intervals for 40 min after addition of 0.5 μM LatA. A single z-plane at the level of the TJ is shown. Time after LatA addition and TER, normalized to TER before LatA addition, are shown in each frame. Open arrows show aggregation and fusion of actin at the apical surface. Solid arrows show changes of mRFP1-occludin fluorescent intensity along the TJ and formation of mRFP1-occludin containing vesicles. Bar, 20 μm. (D) Confluent monolayers stably expressing mRFP1-occludin (shown) and EGFP-β-actin (not shown) were imaged as z-stacks at 1-min intervals for 40 min after addition of 0.5 μM LatA. A single z-plane at the level of the TJ is shown. Time after LatA addition is shown in each frame. Arrows show multiple vesicles emanating from the TJ beginning 2 min after LatA addition. Bar, 10 μm. (E) Confluent monolayers stably expressing mRFP1-occludin (shown) and EGFP-β-actin (not shown) were cooled to 14°C, treated with 0.5 μM LatA for 30 min, and warmed to 37°C. They were then imaged as limited z-stacks at 10-s intervals. A single z-plane at the level of the TJ is shown. Arrows show the process of occludin concentration, budding, and detachment to form a single vesicle. Bar, 2 μm. (F) Monolayers were treated as in E to synchronize vesicle budding. 10 min after warming to 37°C monolayers were fixed with –20°C methanol/BS3, stained for occludin, and z-stacks collected. Representative xz reconstructions of control and LatA-treated monolayers are shown. LatA treatment causes the appearance of budding and detached occludin-positive structures near the lower portion of the TJ, i.e., adjacent to the border of the TJ and lateral membrane.
Figure 4.
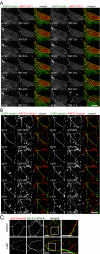
LatA-induced TER loss does not correlate with redistribution of ZO-1, claudin-1, or E-cadherin. (A) Confluent monolayers stably expressing EGFP-β-actin (left) and mRFP1-ZO-1 (middle) were imaged as z-stacks at 1-min intervals for 40 min after addition of 0.5 μM LatA. A single z-plane at the level of the TJ is shown. Time after LatA addition and TER, normalized to TER before LatA addition, are shown in each frame. Open arrows show aggregation and fusion of actin rich regions in apical surface. Solid arrows show changes of mRFP1-ZO-1 fluorescent intensity along the TJ. Bar, 20 μm. (B) Confluent monolayers stably expressing EGFP-claudin-1 (left) and mRFP1-occludin (middle) were imaged as z-stacks at 1-min intervals for 40 min after addition of 0.5 μM LatA. A single z-plane at the level of the TJ is shown. Time after LatA addition and TER, normalized to TER before LatA addition, are shown in each frame. Open arrows show changes in EGFP-claudin-1 fluorescence intensity along the TJ after LatA addition. These are not apparent until 12 min after LatA addition, when TER has already fallen by 62%. Solid arrows show changes of mRFP1-occludin fluorescent intensity along the TJ and formation of mRFP1-occludin containing vesicles. Bar, 20 μm. (C) MDCK monolayers not treated (top) or treated with 0.5 μM LatA (bottom) for 20 min were fixed with –20°C methanol/BS3 and stained for occludin (left) and E-cadherin (middle). Although the distribution of occludin is disrupted by LatA treatment, that of E-cadherin is not (merged images). This is confirmed at higher magnification (far right). Bars, 5 μm.
Figure 5.
LatA-induced TER loss and occludin redistribution require membrane traffic. (A) MDCK monolayers were incubated at indicated temperature for 30 min before addition of 0.5 μM LatA. Because reduced temperature elevated TER, values 30 min after LatA addition are normalized to those before LatA addition. (B) MDCK monolayers expressing EGFP-β-actin (left) and mRFP1-occludin (middle) incubated at 14°C were imaged as z-stacks at 1-min intervals for 40 min after addition of 0.5 μM LatA. A single z-plane at the level of the TJ is shown. Time after LatA addition is shown in each frame. In contrast to 37°C, LatA did not induce occludin internalization at 14°C. However, actin was lost from the TJ. This can be best appreciated in the merged image where, due to loss of EGFP-β-actin, the TJ changes from yellow to red. Bar, 20 μm. (C) Monolayers were incubated in HBSS with 0.4 M sucrose for 1 h before addition of LatA. TER is shown 30 min after addition of LatA. Incubation in HBSS with 0.4 M sucrose decreased TER to 36 ± 2.3% of control, but LatA addition did not cause further TER loss. (D) MDCK monolayers were equilibrated in 37°C HBSS, 14°C HBSS, or 37°C HBSS with 0.4 M sucrose for 1 h and then treated without or with 0.5 μM LatA for 30 min under the same conditions. Monolayers were fixed with –20°C methanol/BS3 and stained using mouse anti-occludin antibody. Disruption of occludin at the TJ and increased numbers of occludin-containing vesicles are apparent after LatA treatment. As in the live cell imaging (B), incubation at 14°C prevents accumulation of occludin-containing vesicles. Incubation in HBSS with 0.4 M sucrose also prevents accumulation of occludin-containing vesicles. Bar, 10 μm. (E) Morphometric analysis of occludin internalization. Each data set shows individual numbers of occludin vesicles per cell for 20 representative cells and the mean number of occludin vesicles per cell.
Figure 6.
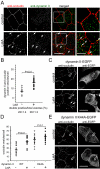
Occludin is internalized through a dynamin-II dependent pathway. (A) MDCK monolayers not treated (top) or treated with 0.5 μM LatA (bottom) for 30 min were fixed with –20°C methanol/BS3 and stained for occludin (left) and dynamin II (middle). Increased colocalization is apparent after LatA treatment (merged images, arrows). Bar, 10 μm. Colocalization is more readily seen at higher magnification (far right). Bar, 5 μm. (B) Morphometric analysis of occludin and dynamin II colocalization. Each data set shows individual numbers of vesicles that label for both occludin and dynamin II per cell for 20 representative cells and the mean number of such vesicles per cell. The percentage of occludin vesicles that contain dynamin II is shown below each data set. (C) MDCK monolayers were transiently transfected with dynamin II-EGFP and incubated without or with 0.5 μM LatA for 30 min. After fixation with –20°C methanol/BS3 monolayers were stained for occludin (left) and EGFP (right). Transfected cells (open arrows) were identified by the presence of EGFP. Cells expressing dynamin II-EGFP internalize occludin after LatA treatment similarly to nontransfected cells. Arrows show accumulation of occludin containing vesicles in dynamin II-EGFP-transfected cell after LatA treatment. Bar, 10 μm. (D) Morphometric analysis of occludin internalization. Each data set shows individual numbers of occludin vesicles per cell for 20 representative cells and the mean number of occludin vesicles per cell. (E) MDCK monolayers were transiently transfected with dynamin II K44A-EGFP and incubated without or with 0.5 μM LatA for 30 min. After fixation with –20°C methanol/BS3 monolayers were stained for occludin (left) and EGFP (right). Transfected cells (open arrow) were identified by the presence of EGFP. Cells expressing dynamin II K44A-EGFP have increased numbers of occludin vesicles before LatA treatment but do not augment this number further after LatA treatment. Morphometric analysis of these conditions is shown in D. Bar, 10 μm.
Figure 7.
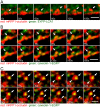
Occludin colocalizes with caveolin-1, but not clathrin light chain A1, during LatA-induced internalization. (A) MDCK monolayers expressing mRFP1-occludin and EYFP-clathrin light chain A1 were imaged after LatA treatment. The images, at 30-s intervals, show internalization of mRFP1-occludin (arrows) but no change in EYFP-clathrin light chain A1 distribution. Bar, 2 μm. (B) MDCK monolayers expressing mRFP1-occludin and caveolin-1-EGFP were imaged after LatA treatment. The images, at 15-s intervals, show cointernalization of mRFP1-occludin and caveolin-1-EGFP (arrows). Bar, 2 μm. (C) MDCK monolayers expressing mRFP1-occludin and caveolin-1-EGFP were imaged after LatA treatment. The images, at 15-s intervals, follow a vesicle internalized 10–15 min previously (arrows). mRFP1-occludin and caveolin-1-EGFP are initially colocalized within the vesicle. Some of the mRFP1-occludin then separates (arrowheads) from the caveolin-1-EGFP, first within what seems to be a single vesicle and later in a separate vesicle (arrowheads) that does not contain caveolin-1-EGFP. Bar, 2 μm.
Figure 8.
Occludin colocalizes primarily with caveolin-1, but not clathrin, EEA1, or LAMP-1, after LatA-induced internalization. (A) MDCK monolayers were cooled to 14°C, treated with 0.5 μM LatA for 30 min, and warmed to 37°C for indicated times before being fixed with –20°C methanol/BS3 and stained for occludin (left) and caveolin-1 (middle). Increased colocalization is apparent after warming, and is most prominent after 10 min (merged images, arrows). This colocalization is confirmed at higher magnification (far right). Bars: 5 μm. (B) MDCK monolayers were cooled to 14°C, treated with 0.5 μM LatA for 30 min, and warmed to 37°C for indicated times before being fixed with –20°C methanol/BS3 and stained for occludin (left) and clathrin heavy chain (middle). No significant colocalization is apparent before or after warming (merged images). This lack of colocalization is confirmed at higher magnification (far right). Bars, 5 μm. (C) MDCK monolayers were cooled to 14°C, treated with 0.5 μM LatA for 30 min, and warmed to 37°C for indicated times before being fixed with –20°C methanol/BS3 and stained for occludin (left) and EEA1 (middle). There is no significant colocalization before or 10 min after warming, but limited colocalization is present 20 min after warming (merged images, arrows). Colocalization is confirmed at higher magnification (far right). Bars, 5 μm. (D) MDCK monolayers were cooled to 14°C, treated with 0.5 μM LatA for 30 min, and warmed to 37°C for indicated times before being fixed with –20°C methanol/BS3 and stained for occludin (left) and LAMP-1 (middle). There is no significant colocalization before or 10 min after warming, but limited colocalization is present 20 min after warming (merged images, arrows). Colocalization is confirmed at higher magnification (far right). Bars, 5 μm.
Figure 9.
Occludin passes though a caveolin-1-containing compartment after LatA-induced internalization. Morphometric analysis of occludin colocalization with caveolin-1, clathrin heavy chain, EEA1, and LAMP-1 0, 10, and 20 min after warming. Each data set shows the fraction of vesicles that label for both occludin and the other indicated antigen for 20 representative cells in each condition.
Figure 10.
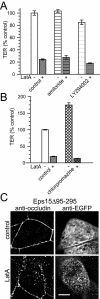
Neither macropinocytosis nor clathrin-mediated endocytosis are required for LatA-induced barrier dysfunction or occludin internalization. (A) Monolayers pretreated with amiloride or LY294002 were treated with 0.5 μM LatA. TER is shown 30 min after addition of LatA. Neither macropinocytosis inhibitor prevented TER loss after LatA addition. (B) Monolayers treated with chlorpromazine showed a marked TER increase relative to control monolayers without chlorpromazine treatment. However, treatment with chlorpromazine, which inhibits clathrin-mediated endocytosis, did not prevent TER loss after LatA addition. (C) MDCK monolayers were transiently transfected with EGFP-EpsΔ95-295 and incubated without or with 0.5 μM LatA for 30 min. After fixation with –20°C methanol/BS3 monolayers were stained for occludin (left) and EGFP (right). Transfected cells were identified by the presence of EGFP. Cells expressing EGFP-EpsΔ95-295 internalized occludin in a manner indistinguishable from nontransfected cells, e.g., Figure 4D, after LatA treatment. Bar, 5 μm.
Figure 11.
Caveolae-mediated endocytosis is required for LatA-induced barrier dysfunction and occludin internalization. (A) Treatment of monolayers with MBCD or filipin III caused a modest reduction in TER relative to control monolayers without MBCD or filipin III treatment. However, no further reduction in TER occurred after LatA addition. (B) MDCK monolayers were pretreated with MBCD and then treated with additional MBCD or MBCD-cholesterol complexes (MBCD+cholesterol) before treatment with 0.5 μM LatA for 30 min. As above, MBCD prevented LatA-induced TER loss, but sensitivity to LatA was restored by cholesterol repletion. (C) MDCK monolayers were pretreated with MBCD and then treated with additional MBCD or MBCD–cholesterol complexes (MBCD+cholesterol) before treatment with 0.5 μM LatA for 30 min. After fixation with –20°C methanol/BS3 monolayers were stained for occludin. Consistent with the effects on TER, MBCD prevented LatA-induced occludin internalization, but sensitivity to LatA was restored by cholesterol repletion. Bar, 5 μm. (D) Morphometric analysis of occludin internalization in MBCD-treated monolayers. Each data set shows individual numbers of occludin vesicles per cell for 20 representative cells and the mean number of occludin vesicles per cell. MBCD prevented LatA-induced increases in occludin-containing vesicles.
Similar articles
- Clathrin- and caveolin-1-independent endocytosis: entry of simian virus 40 into cells devoid of caveolae.
Damm EM, Pelkmans L, Kartenbeck J, Mezzacasa A, Kurzchalia T, Helenius A. Damm EM, et al. J Cell Biol. 2005 Jan 31;168(3):477-88. doi: 10.1083/jcb.200407113. Epub 2005 Jan 24. J Cell Biol. 2005. PMID: 15668298 Free PMC article. - Chloride channel ClC- 2 enhances intestinal epithelial tight junction barrier function via regulation of caveolin-1 and caveolar trafficking of occludin.
Nighot PK, Leung L, Ma TY. Nighot PK, et al. Exp Cell Res. 2017 Mar 1;352(1):113-122. doi: 10.1016/j.yexcr.2017.01.024. Epub 2017 Feb 2. Exp Cell Res. 2017. PMID: 28161538 Free PMC article. - Inducible expression of claudin-1-myc but not occludin-VSV-G results in aberrant tight junction strand formation in MDCK cells.
McCarthy KM, Francis SA, McCormack JM, Lai J, Rogers RA, Skare IB, Lynch RD, Schneeberger EE. McCarthy KM, et al. J Cell Sci. 2000 Oct;113 Pt 19:3387-98. doi: 10.1242/jcs.113.19.3387. J Cell Sci. 2000. PMID: 10984430 - Endocytosis and recycling of tight junction proteins in inflammation.
Utech M, Mennigen R, Bruewer M. Utech M, et al. J Biomed Biotechnol. 2010;2010:484987. doi: 10.1155/2010/484987. J Biomed Biotechnol. 2010. PMID: 20011071 Free PMC article. Review. - Stimulus-induced reorganization of tight junction structure: the role of membrane traffic.
Yu D, Turner JR. Yu D, et al. Biochim Biophys Acta. 2008 Mar;1778(3):709-16. doi: 10.1016/j.bbamem.2007.07.027. Epub 2007 Aug 24. Biochim Biophys Acta. 2008. PMID: 17915190 Free PMC article. Review.
Cited by
- Microbiota-Host Immunity Communication in Neurodegenerative Disorders: Bioengineering Challenges for In Vitro Modeling.
Boeri L, Perottoni S, Izzo L, Giordano C, Albani D. Boeri L, et al. Adv Healthc Mater. 2021 Apr;10(7):e2002043. doi: 10.1002/adhm.202002043. Epub 2021 Mar 4. Adv Healthc Mater. 2021. PMID: 33661580 Free PMC article. Review. - Tight junction pore and leak pathways: a dynamic duo.
Shen L, Weber CR, Raleigh DR, Yu D, Turner JR. Shen L, et al. Annu Rev Physiol. 2011;73:283-309. doi: 10.1146/annurev-physiol-012110-142150. Annu Rev Physiol. 2011. PMID: 20936941 Free PMC article. Review. - Progesterone decreases gut permeability through upregulating occludin expression in primary human gut tissues and Caco-2 cells.
Zhou Z, Bian C, Luo Z, Guille C, Ogunrinde E, Wu J, Zhao M, Fitting S, Kamen DL, Oates JC, Gilkeson G, Jiang W. Zhou Z, et al. Sci Rep. 2019 Jun 10;9(1):8367. doi: 10.1038/s41598-019-44448-0. Sci Rep. 2019. PMID: 31182728 Free PMC article. - Inactivation of paracellular cation-selective claudin-2 channels attenuates immune-mediated experimental colitis in mice.
Raju P, Shashikanth N, Tsai PY, Pongkorpsakol P, Chanez-Paredes S, Steinhagen PR, Kuo WT, Singh G, Tsukita S, Turner JR. Raju P, et al. J Clin Invest. 2020 Oct 1;130(10):5197-5208. doi: 10.1172/JCI138697. J Clin Invest. 2020. PMID: 32516134 Free PMC article. - Occludin phosphorylation and ubiquitination regulate tight junction trafficking and vascular endothelial growth factor-induced permeability.
Murakami T, Felinski EA, Antonetti DA. Murakami T, et al. J Biol Chem. 2009 Jul 31;284(31):21036-46. doi: 10.1074/jbc.M109.016766. Epub 2009 May 28. J Biol Chem. 2009. PMID: 19478092 Free PMC article.
References
- Bazzoni, G., Martinez-Estrada, O. M., Orsenigo, F., Cordenonsi, M., Citi, S., and Dejana, E. (2000). Interaction of junctional adhesion molecule with the tight junction components ZO-1, cingulin, and occludin. J. Biol. Chem. 275, 20520–20526. - PubMed
- Benmerah, A., Bayrou, M., Cerf-Bensussan, N., and Dautry-Varsat, A. (1999). Inhibition of clathrin-coated pit assembly by an Eps15 mutant. J. Cell Sci. 112, 1303–1311. - PubMed
- Bentzel, C. J., Hainau, B., Ho, S., Hui, S. W., Edelman, A., Anagnostopoulos, T., and Benedetti, E. L. (1980). Cytoplasmic regulation of tight-junction permeability: effect of plant cytokinins. Am. J. Physiol. 239, C75–C89. - PubMed
Publication types
MeSH terms
Substances
Grants and funding
- P30 DK042086/DK/NIDDK NIH HHS/United States
- P30 CA14599/CA/NCI NIH HHS/United States
- P30 CA014599/CA/NCI NIH HHS/United States
- R01DK068271/DK/NIDDK NIH HHS/United States
- R01 DK061931/DK/NIDDK NIH HHS/United States
- R01DK061931/DK/NIDDK NIH HHS/United States
- R01 DK068271/DK/NIDDK NIH HHS/United States
- P30 DK42086/DK/NIDDK NIH HHS/United States
LinkOut - more resources
Full Text Sources
Other Literature Sources
Research Materials
