Modeling linkage disequilibrium in natural populations: the example of the Soay sheep population of St. Kilda, Scotland - PubMed (original) (raw)
Modeling linkage disequilibrium in natural populations: the example of the Soay sheep population of St. Kilda, Scotland
Allan F McRae et al. Genetics. 2005 Sep.
Abstract
The use of linkage disequilibrium to localize the genes underlying quantitative traits has received considerable attention in the livestock genetics community over the past few years. This has resulted in the investigation of linkage disequilibrium structures of several domestic livestock populations to assess their potential use in fine-mapping efforts. However, the linkage disequilibrium structure of free-living populations has been less well investigated. As the direct evaluation of linkage disequilibrium can be both time consuming and expensive the use of simulations that include as many aspects of population history as possible is advocated as an alternative. A simulation of the linkage disequilibrium structure of the Soay sheep population of St. Kilda, Scotland, is provided as an example. The simulated population showed significant decline of linkage disequilibrium with genetic distance and low levels of background linkage disequilibrium, indicating that the Soay sheep population is a viable resource for linkage disequilibrium fine mapping of quantitative trait loci.
Figures
Figure 1.
Outline map of part of the St. Kilda archipelago. The Soay sheep were restricted to the island of Soay until 1932 when a small group was moved to Hirta, which now holds the majority of the population. The Village Bay study area is shaded.
Figure 2.
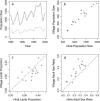
Census population size of the Soay sheep population on Hirta for the years 1955–2001. The population size is characterized by its frequent crashes when population size decreases by up to 60% in 1 year. The weak upward trend in population size with time is shown (dashed line).
Figure 3.
Comparison between Village Bay and Hirta population data. (a) Plot of census population sizes of Hirta (solid line) and the Village Bay population (dashed line). (b) Scatter plot showing the strong correlation between the census population sizes of Hirta and the Village Bay (r = 0.962, P < 0.0001). (c) Comparison of the proportion of lambs observed in Hirta and the Village Bay. The dashed line indicates a perfect relationship. (d) Comparison of the adult sex ratio (male/female) in the two populations.
Figure 4.
Simulated linkage disequilibrium structure of the Soay sheep population. Each point is the absolute value of Lewontin's -statistic from a random pair of loci from one simulation (1000 replicates). The mean
-value over successive intervals of 2.5 cM is given by a horizontal line.
Figure 5.
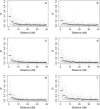
Analysis of the stability of simulated linkage disequilibrium structure to variation in population parameters. Each plot shows the linkage disequilibrium structure as given by 1000 simulated replicates using altered parameter values: (a) decreasing the effective population size used to simulate the initial haplotypes, (b) increasing the initial effective population size by a factor of two, (c) using population dynamics parameters at the “low” end of their 95% confidence interval, (d) using population dynamics parameters at the “high” end of their confidence interval, (e) decreasing the coefficient of variation of male reproductive success by a factor of two, and (f) increasing the variation of male reproductive success by a factor of two. Horizontal bars give the mean -value over successive intervals of 2.5 cM.
Similar articles
- Mapping quantitative trait loci in a wild population using linkage and linkage disequilibrium analyses.
Hernández-Sánchez J, Chatzipli A, Beraldi D, Gratten J, Pilkington JG, Pemberton JM. Hernández-Sánchez J, et al. Genet Res (Camb). 2010 Aug;92(4):273-81. doi: 10.1017/S0016672310000340. Genet Res (Camb). 2010. PMID: 20943008 - Identification of quantitative trait loci underlying milk traits in Spanish dairy sheep using linkage plus combined linkage disequilibrium and linkage analysis approaches.
Garcia-Gámez E, Gutiérrez-Gil B, Suarez-Vega A, de la Fuente LF, Arranz JJ. Garcia-Gámez E, et al. J Dairy Sci. 2013 Sep;96(9):6059-69. doi: 10.3168/jds.2013-6824. Epub 2013 Jun 28. J Dairy Sci. 2013. PMID: 23810588 - Linkage disequilibrium in domestic sheep.
McRae AF, McEwan JC, Dodds KG, Wilson T, Crawford AM, Slate J. McRae AF, et al. Genetics. 2002 Mar;160(3):1113-22. doi: 10.1093/genetics/160.3.1113. Genetics. 2002. PMID: 11901127 Free PMC article. - Linkage disequilibrium mapping: the role of population history, size, and structure.
Chapman NH, Thompson EA. Chapman NH, et al. Adv Genet. 2001;42:413-37. doi: 10.1016/s0065-2660(01)42034-7. Adv Genet. 2001. PMID: 11037333 Review. - Mapping genes through the use of linkage disequilibrium generated by genetic drift: 'drift mapping' in small populations with no demographic expansion.
Terwilliger JD, Zöllner S, Laan M, Pääbo S. Terwilliger JD, et al. Hum Hered. 1998 May-Jun;48(3):138-54. doi: 10.1159/000022794. Hum Hered. 1998. PMID: 9618061 Review.
Cited by
- Fine-mapping quantitative trait loci with a medium density marker panel: efficiency of population structures and comparison of linkage disequilibrium linkage analysis models.
Roldan DL, Gilbert H, Henshall JM, Legarra A, Elsen JM. Roldan DL, et al. Genet Res (Camb). 2012 Aug;94(4):223-34. doi: 10.1017/S0016672312000407. Genet Res (Camb). 2012. PMID: 22950902 Free PMC article. - Compelling evidence that a single nucleotide substitution in TYRP1 is responsible for coat-colour polymorphism in a free-living population of Soay sheep.
Gratten J, Beraldi D, Lowder BV, McRae AF, Visscher PM, Pemberton JM, Slate J. Gratten J, et al. Proc Biol Sci. 2007 Mar 7;274(1610):619-26. doi: 10.1098/rspb.2006.3762. Proc Biol Sci. 2007. PMID: 17254985 Free PMC article. - Linkage disequilibrium and demographic history of wild and domestic canids.
Gray MM, Granka JM, Bustamante CD, Sutter NB, Boyko AR, Zhu L, Ostrander EA, Wayne RK. Gray MM, et al. Genetics. 2009 Apr;181(4):1493-505. doi: 10.1534/genetics.108.098830. Epub 2009 Feb 2. Genetics. 2009. PMID: 19189949 Free PMC article. - Development of a linkage map and mapping of phenotypic polymorphisms in a free-living population of Soay sheep (Ovis aries).
Beraldi D, McRae AF, Gratten J, Slate J, Visscher PM, Pemberton JM. Beraldi D, et al. Genetics. 2006 Jul;173(3):1521-37. doi: 10.1534/genetics.106.057141. Genetics. 2006. PMID: 16868121 Free PMC article. - Genomic Diversity in Pig (Sus scrofa) and its Comparison with Human and other Livestock.
Zhang C, Plastow G. Zhang C, et al. Curr Genomics. 2011 Apr;12(2):138-46. doi: 10.2174/138920211795564386. Curr Genomics. 2011. PMID: 21966252 Free PMC article.
References
- Boyd, J. M., 1953. The sheep population of Hirta. St. Kilda. Scott. Nat. 65: 25–28.
- Boyd, J. M., 1974. Introduction, pp. 1–7 in Island Survivors: The Ecology of the Soay Sheep of St. Kilda, edited by P. A. Jewell, C. Milner and J. M. Boyd. Athlone Press, London.
- Boyd, J. M., and I. L. Boyd, 1990. The Hebrides. Collins, London.
- Boyd, J. M., J. M. Doney, R. G. Gunn and P. A. Jewell, 1964. The Soay sheep of the island of Hirta, St. Kilda. A study of a feral population. Proc. Zool. Soc. Lond. 142: 129–163.
- De Gooijer, J. G., 2001. Cross-validation criteria for SETAR model selection. J. Time Ser. Anal. 22: 267–281.
Publication types
MeSH terms
LinkOut - more resources
Full Text Sources
Research Materials
Miscellaneous


