Bacterial shape and ActA distribution affect initiation of Listeria monocytogenes actin-based motility - PubMed (original) (raw)
Bacterial shape and ActA distribution affect initiation of Listeria monocytogenes actin-based motility
Susanne M Rafelski et al. Biophys J. 2005 Sep.
Abstract
We have examined the process by which the intracellular bacterial pathogen Listeria monocytogenes initiates actin-based motility and determined the contribution of the variable surface distribution of the ActA protein to initiation and steady-state movement. To directly correlate ActA distributions to actin dynamics and motility of live bacteria, ActA was fused to a monomeric red fluorescent protein (mRFP1). Actin comet tail formation and steady-state bacterial movement rates both depended on ActA distribution, which in turn was tightly coupled to the bacterial cell cycle. Motility initiation was found to be a highly complex, multistep process for bacteria, in contrast to the simple symmetry breaking previously observed for ActA-coated spherical beads. F-actin initially accumulated along the sides of the bacterium and then slowly migrated to the bacterial pole expressing the highest density of ActA as a tail formed. Early movement was highly unstable with extreme changes in speed and frequent stops. Over time, saltatory motility and sensitivity to the immediate environment decreased as bacterial movement became robust at a constant steady-state speed.
Figures
FIGURE 1
ActA distribution class affects speed and tail formation. (A) A bacterium expressing ActA-RFP associated with an actin comet tail in cytoplasmic extract. Inset shows ActA distribution. The actin tail formed at the end with more ActA (rear). Bar is 2 _μ_m. (B) Representative individual examples of the five ActA-RFP surface distribution classes found for L. monocytogenes quantitated by calculating the average relative intensity at each point along the bacterial length (position in micrometers from rear). Shaded bacterial outlines represent the length of each example bacterium shown in each class. Asterisk on the far right indicates the metric used to categorize classes 3–5. Bar is 2 _μ_m. (C) Average bacterial length in classes 1–5, calculated for 23, 38, 54, 34, and 45 bacteria, respectively. ActA distributions correlated with bacterial length. Each point is significantly different from all others (p < 0.05 by rank sum test (46)). (D) Average steady-state speed of bacteria for each distribution class. Bacteria of distribution classes 1, 2, and 3 moved at significantly greater speeds than classes 4 and 5 (see asterisks, p < 0.05 by rank sum test. Error bars show standard deviations, and boxes show standard error). (E) Percentage of a subpopulation of bacteria associated with actin tails at 10 min after mixing (112 total bacteria). Bacteria of distribution classes 1, 2, and 3 had a significantly greater percentage of tails than classes 4 and 5 (asterisks; _z_-test, p < 0.05). Error bars show 95% confidence interval.
FIGURE 2
Initial cloud accumulation and movement of L. monocytogenes. A time course of actin accumulation, polar cloud formation, and initial movement for a representative bacterium with a unipolar (A, class 2) and a bipolar (B, class 5) ActA distribution. (A and B) Left panels show actin fluorescence and right panels show phase contrast. Insets shown in the earliest panel are ActA distributions in the first frame of the movie. Arrows in the phase-contrast images indicate the future direction of movement. Right graph panels are relative fluorescence intensities along the length of the bacterium (0 is the front), indicated in gray on the x axis in the latest panel (position in micrometers; left graph; linescan intensity), and around the circumference of the bacterium (0° is the rear of the bacterium, seen in C; right graph; radial intensity). ActA distribution, gray line, is calculated from the first frame of the movie, whereas the actin distribution, black line, changes for each image. (A) Initial actin accumulation correlated with the unipolar ActA distribution profile (125 s), with accumulation along the sides near the rear end and less directly at the pole. As lateral actin accumulation continued, the bacterium slowly moved forward (180 s). Actin then began to accumulate directly at the rear pole and less along the sides as the cloud became fully polar and reached its maximum intensity (230 s). The polar actin cloud rapidly turned into an actin tail, with weaker intensity along the bacterial surface and a fast burst of speed (245 s). Bar is 2 _μ_m. (B) Initial actin cloud formation correlated with the bipolar ActA distribution profile (145–320 s). Actin was visible near both ends (white arrows) and less at the septation zone. More ActA was visible along the sides of the bacterium than at either pole. Notice the shoulder in the actin distribution in the linescan intensity graph and the small peaks near the front of the bacterium (±180°) on the radial intensities graph at 320 s. As actin continued to accumulate along the sides, the bacterium slowly moved forward. Actin then began to accumulate directly at the rear pole of the bacterium, forming a polar actin cloud (410 s) characterized by a continuous distribution gradient of actin on the surface from the front to the rear spanning the septation zone, less actin along the sides, and a more rearward position of the actin peak. The formation of a polar actin cloud took longer than for the unipolar example. Bar is 2 _μ_m. (C and D) Relative actin intensities over time at specific positions on the bacterial surface before tail formation. Intensities at the points on both sides of the bacterium were averaged. Curves are color coded with position around bacterial circumference (and include the rear and front as well as 45°, 90°, and 135° in each direction). The shaded region indicates the period of forward movement.
FIGURE 3
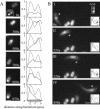
Both ends of a bipolar ActA bacterium (class 5) compete for actin accumulation and cloud formation. (A) Time course of cloud and tail formation for a bipolar ActA bacterium. Left panels show actin fluorescence, and inset is ActA fluorescence in the first frame of the movie. Right panels show ActA (gray) and actin (black) linescans along the length of the bacterium (indicated in shaded area along the x axis). The first image was taken ∼12 min after mixing bacteria with extract. Bar is 2 _μ_m. (B) A bipolar ActA bacterium (class 5) associated with an actin tail. Image shows actin fluorescence, top right inset is ActA, and bottom right inset is the linescan of ActA (gray) and actin (black) for each panel. Panels I and III show that the front end sometimes nucleated an actin cloud, seen as a distinct peak in the linescan (arrows), but this did not occur at all times during movement. Panels II and IV show the polar actin distribution along the bacterium typical of normal tails. Bar is 2 _μ_m.
FIGURE 4
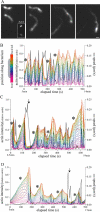
Early hopping regime of motility initiation. (A) Two bacteria with discontinuous hopping actin tails starting at ∼5 min after addition to extract (fluorescent actin). Inset in the earliest panel is the ActA signal on the bacteria. The top bacterium is graphed in B. Bar is 2 _μ_m. (B) Graph of top bacterium in A, displaying the instantaneous speed trace (in black along the right axis) and a color coded trace of relative fluorescence intensity over time, with each color representing a position along the bacterial surface. Asterisks indicate polar cloud formation before bursts of speed. Lower labels on the x axis refer to the approximate time since mixing of the bacterium and extract. Movie 6 in the Supplementary Materials shows the frame-by-frame image sequence of the bacterium and its actin intensity distribution for each frame to reference with this graph. (C and D) Two further examples of “hopping” bacteria (Movies 7 and 8). Note the different speeds for C. Arrow indicates a time in the trajectory when the bacterium lost association with its actin tail, tumbled randomly, slowed after interactions with other components in the extract, and reinitiated motility (see phase image in Movie 7).
FIGURE 5
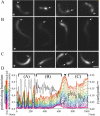
Maturation of the actin tail and transition into steady-state motility. (A) Images of hopping tails early in initiation as in Fig. 4. (B) Actin tails 20–30 min after mixing. Tails were no longer discontinuous; rather, they were very long and weak in intensity. (C) Bright, shorter, steady-state actin tails imaged 30 min and later after mixing with extract. Arrows indicate positions of bacteria. Bar is 2 _μ_m. (D) Graph of bacterial speed and actin intensities for each frame of the individual bacterium marked with an asterisk in A_–_C. Brackets refer to the three phases of maturation seen in the images. Arrowhead indicates loss of speed when the bacterium ran into its own tail but rapidly recovered steady-state motility. Lower labels on x axis refer to approximate time since mixing bacteria and extract.
FIGURE 6
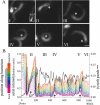
Decrease in sensitivity to the environment associated with the transition into steady state. (A) A bacterium, indicated by the asterisk, initiated motility (I) then stopped suddenly and dramatically due to another tail in its path (II), which caused it to reinitiate motility and hop again. Its trajectory was interrupted twice more by another and its own tail (IV and V) without much effect on its tail intensity or speed. The inset shows the ActA distribution. Bar is 2 _μ_m. (B) Speed and actin intensity graph of the bacterium in A. Roman numerals on the graph refer to time points in part A for comparison. Arrows mark the increase in actin near the front of the bacterium during the collisions. Notice the dramatic stop and reinitiation of a polar cloud at II and the comparatively slight reductions in speed at IV and V. Lower labels on the x axis refer to the time since mixing of the bacterium and extract.
FIGURE 7
Motility initiation of ActA GRR mutant bacteria. (A) Bacterium expressing wild-type ActA-RFP associated with a steady-state actin tail at 25 min after mixing with extract. (B) Bacterium expressing mutant GRR-RFP associated with a hopping tail between 30 and 35 min after mixing. Depolymerization of the unstable tails is very rapid such that often bacteria seem to be associated with an actin cloud or very short actin tail, distinct from the hopping motility of wild-type bacteria (Fig. 4 A). Panels show actin fluorescence, and insets show ActA fluorescence in the first frame of the movie. Bar is 2 _μ_m. (C) Speed and actin intensity graph of the bacterium in B. Notice the extreme bursts of actin accumulation and speeds and complete stops and loss of actin more severe than for wild-type hopping bacteria (Fig. 4, B_–_D).
FIGURE 8
Cloud and tail formation on L. monocytogenes inside host cells. (A) Several ActA-RFP-expressing L. monocytogenes inside an MDCK cell expressing actin-GFP. The left panel shows ActA fluorescence, the middle panel shows actin, and the right panel shows phase contrast. Circles indicate bacteria with low levels of ActA that were not associated with an actin cloud. (B) L. monocytogenes inside a PtK2 cell, expressing actin-GFP that divided and initiated movement with division. Both daughter bacteria began moving concurrently. The left panel shows actin fluorescence, and the right panel shows phase contrast. (C) L. monocytogenes initiated movement inside a PtK2 cell without division, forming a polar cloud and then a tail as in Fig. 2. Bar is 2 _μ_m.
FIGURE 9
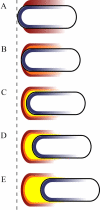
Model of the transition from initial actin accumulation to tail formation and movement. Black outline represents the bacterium. The polar ActA distribution on the surface is shown in blue. The actin that polymerized first (oldest actin) is shown in red, and the newest is in yellow. The dashed line indicates the stationary laboratory frame of reference. (A) Initial actin accumulation (red) occurs preferentially along the sides as the hemispherical poles have a disadvantage toward actin accumulation due to their greater curvature. (B) Side accumulation leads to slow forward movement, and a more rearward region of the bacterium is brought in contact with prepolymerized actin (red) remaining in the environment. New actin polymerizes (orange) along the sides but closer to the rear pole. (C) Further forward movement brings the pole itself into contact with older remaining actin (red and orange) stationary in the environment. The newest actin (yellow) is now able to accumulate rapidly at the pole due to autocatalytic actin nucleation and leads to polar cloud formation. (D and E) Repeated polar actin accumulation allows greater forward movement as the actin tail forms.
Similar articles
- Adapter protein SH2-Bbeta stimulates actin-based motility of Listeria monocytogenes in a vasodilator-stimulated phosphoprotein (VASP)-dependent fashion.
Diakonova M, Helfer E, Seveau S, Swanson JA, Kocks C, Rui L, Carlier MF, Carter-Su C. Diakonova M, et al. Infect Immun. 2007 Jul;75(7):3581-93. doi: 10.1128/IAI.00214-07. Epub 2007 Apr 23. Infect Immun. 2007. PMID: 17452473 Free PMC article. - The bacterial actin nucleator protein ActA of Listeria monocytogenes contains multiple binding sites for host microfilament proteins.
Pistor S, Chakraborty T, Walter U, Wehland J. Pistor S, et al. Curr Biol. 1995 May 1;5(5):517-25. doi: 10.1016/s0960-9822(95)00104-7. Curr Biol. 1995. PMID: 7583101 - Ena/VASP proteins contribute to Listeria monocytogenes pathogenesis by controlling temporal and spatial persistence of bacterial actin-based motility.
Auerbuch V, Loureiro JJ, Gertler FB, Theriot JA, Portnoy DA. Auerbuch V, et al. Mol Microbiol. 2003 Sep;49(5):1361-75. doi: 10.1046/j.1365-2958.2003.03639.x. Mol Microbiol. 2003. PMID: 12940993 - How the Listeria monocytogenes ActA protein converts actin polymerization into a motile force.
Smith GA, Portnoy DA. Smith GA, et al. Trends Microbiol. 1997 Jul;5(7):272-6. doi: 10.1016/S0966-842X(97)01048-2. Trends Microbiol. 1997. PMID: 9234509 Review. - Intracellular motility. Profilin puts pathogens on the actin drive.
Kocks C. Kocks C. Curr Biol. 1994 May 1;4(5):465-8. doi: 10.1016/s0960-9822(00)00105-6. Curr Biol. 1994. PMID: 7922367 Review.
Cited by
- A microscopic formulation for the actin-driven motion of listeria in curved paths.
Lin Y, Shenoy VB, Hu B, Bai L. Lin Y, et al. Biophys J. 2010 Aug 9;99(4):1043-52. doi: 10.1016/j.bpj.2010.06.001. Biophys J. 2010. PMID: 20712987 Free PMC article. - Listeria monocytogenes invades the epithelial junctions at sites of cell extrusion.
Pentecost M, Otto G, Theriot JA, Amieva MR. Pentecost M, et al. PLoS Pathog. 2006 Jan;2(1):e3. doi: 10.1371/journal.ppat.0020003. Epub 2006 Jan 27. PLoS Pathog. 2006. PMID: 16446782 Free PMC article. - Arp2/3 controls the motile behavior of N-WASP-functionalized GUVs and modulates N-WASP surface distribution by mediating transient links with actin filaments.
Delatour V, Helfer E, Didry D, Lê KH, Gaucher JF, Carlier MF, Romet-Lemonne G. Delatour V, et al. Biophys J. 2008 Jun;94(12):4890-905. doi: 10.1529/biophysj.107.118653. Epub 2008 Mar 7. Biophys J. 2008. PMID: 18326652 Free PMC article. - The Transcriptional Regulator SpxA1 Influences the Morphology and Virulence of Listeria monocytogenes.
Cesinger MR, Daramola OI, Kwiatkowski LM, Reniere ML. Cesinger MR, et al. Infect Immun. 2022 Oct 20;90(10):e0021122. doi: 10.1128/iai.00211-22. Epub 2022 Sep 14. Infect Immun. 2022. PMID: 36102657 Free PMC article. - Host actin polymerization tunes the cell division cycle of an intracellular pathogen.
Siegrist MS, Aditham AK, Espaillat A, Cameron TA, Whiteside SA, Cava F, Portnoy DA, Bertozzi CR. Siegrist MS, et al. Cell Rep. 2015 Apr 28;11(4):499-507. doi: 10.1016/j.celrep.2015.03.046. Epub 2015 Apr 16. Cell Rep. 2015. PMID: 25892235 Free PMC article.
References
- Lorber, B. 1997. Listeriosis. Clin. Infect. Dis. 24:1–9. - PubMed
- Bohne, J., Z. Sokolovic, and W. Goebel. 1994. Transcriptional regulation of prfA and PrfA-regulated virulence genes in Listeria monocytogenes. Mol. Microbiol. 11:1141–1150. - PubMed
- Kocks, C., R. Hellio, P. Gounon, H. Ohayon, and P. Cossart. 1993. Polarized distribution of Listeria monocytogenes surface protein ActA at the site of directional actin assembly. J. Cell Sci. 105:699–710. - PubMed
Publication types
MeSH terms
Substances
LinkOut - more resources
Full Text Sources


