A high-resolution map of active promoters in the human genome - PubMed (original) (raw)
. 2005 Aug 11;436(7052):876-80.
doi: 10.1038/nature03877. Epub 2005 Jun 29.
Affiliations
- PMID: 15988478
- PMCID: PMC1895599
- DOI: 10.1038/nature03877
A high-resolution map of active promoters in the human genome
Tae Hoon Kim et al. Nature. 2005.
Abstract
In eukaryotic cells, transcription of every protein-coding gene begins with the assembly of an RNA polymerase II preinitiation complex (PIC) on the promoter. The promoters, in conjunction with enhancers, silencers and insulators, define the combinatorial codes that specify gene expression patterns. Our ability to analyse the control logic encoded in the human genome is currently limited by a lack of accurate information regarding the promoters for most genes. Here we describe a genome-wide map of active promoters in human fibroblast cells, determined by experimentally locating the sites of PIC binding throughout the human genome. This map defines 10,567 active promoters corresponding to 6,763 known genes and at least 1,196 un-annotated transcriptional units. Features of the map suggest extensive use of multiple promoters by the human genes and widespread clustering of active promoters in the genome. In addition, examination of the genome-wide expression profile reveals four general classes of promoters that define the transcriptome of the cell. These results provide a global view of the functional relationships among transcriptional machinery, chromatin structure and gene expression in human cells.
Figures
Figure 1
Identification and characterization of active promoters in the human genome. (a) Outline of the strategy employed to map TFIID-binding sites in the genome. (b) A representative view of the results from TFIID ChIP-on-chip analysis. The logarithmic ratio (log2 R) of hybridization intensities between TFIID ChIP DNA and a control DNA, and RefSeq gene annotation is shown in the top and middle panels, respectively. A close-up view of two replicate sets of TFIID ChIP-on-chip hybridization signals around the 5′ end of the TCFL1 gene is shown in the bottom panel. Arrows indicate the position of TFIID-binding site determined by a peak-finding algorithm. (c) Distribution of TFIID-binding sites relative to the 5′ end of the matched transcripts. (d & e) Venn diagrams showing number of identified promoters that matched EnsEMBL genes (d) or promoters annotated in DBTSS (e). (f) Chart showing the percentage of IMR90 or DBTSS promoters overlapping with CpG islands, or containing conserved TATA box, INR or DPE elements (see supplemental information for details).
Figure 2
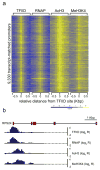
Chromatin modification features of the active promoters. Logarithmic ratios of the ChIP-on-chip hybridization intensities (log2 R) of probes from 0.5 Kbp upstream to 0.5 Kbp downstream of the identified TFIID-binding sites for TFIID, RNAP, AcH3, and MeH3K4 are plotted in a yellow-blue colored scale for 9,330 transcript-matched promoters. The bottom panel shows a yellow-blue colored scale used to color each cell with corresponding log2 R values. (b) A detailed view of TFIID, RNAP, AcH3, and MeH3K4 profiles on the promoter of RPS24 gene.
Figure 3
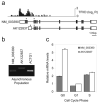
Utilization of multiple promoters by human genes. (a) Annotation of the WEE1 gene locus and the corresponding TFIID-binding profile. Black bars over the first and second exons in transcripts indicate the positions of the primers used for real-time quantitative RT-PCR analysis of each transcript. (b) RT-PCR analysis of NM_003390 and AK122837 transcripts in asynchronous population of IMR90 cells. (c) Real-time quantitative RT-PCR analysis of NM_003390 and AK122837 transcripts in cell cycle synchronized population of IMR90 cells. Transcript levels observed for each cell cycle phase were normalized to the level observed in the asynchronous population.
Figure 4
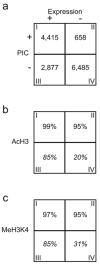
Four distinct classes of promoters define the transcriptome of IMR90 cells. (a) A 2x2 matrix describes the distribution of genes defined by expression and PIC occupancy on the promoter. (b & c) Matrices showing the percentages of genes associated with the AcH3 (b) or MeH3K4 (c) modification for each of the four classes of genes. Italicized numbers in some boxes represent extrapolation from the 29 ENCODE regions.
Similar articles
- Distinct and predictive chromatin signatures of transcriptional promoters and enhancers in the human genome.
Heintzman ND, Stuart RK, Hon G, Fu Y, Ching CW, Hawkins RD, Barrera LO, Van Calcar S, Qu C, Ching KA, Wang W, Weng Z, Green RD, Crawford GE, Ren B. Heintzman ND, et al. Nat Genet. 2007 Mar;39(3):311-8. doi: 10.1038/ng1966. Epub 2007 Feb 4. Nat Genet. 2007. PMID: 17277777 - Characterization of genome-wide enhancer-promoter interactions reveals co-expression of interacting genes and modes of higher order chromatin organization.
Chepelev I, Wei G, Wangsa D, Tang Q, Zhao K. Chepelev I, et al. Cell Res. 2012 Mar;22(3):490-503. doi: 10.1038/cr.2012.15. Epub 2012 Jan 24. Cell Res. 2012. PMID: 22270183 Free PMC article. - Genome-Wide Definition of Promoter and Enhancer Usage during Neural Induction of Human Embryonic Stem Cells.
Poletti V, Delli Carri A, Malagoli Tagliazucchi G, Faedo A, Petiti L, Mazza EM, Peano C, De Bellis G, Bicciato S, Miccio A, Cattaneo E, Mavilio F. Poletti V, et al. PLoS One. 2015 May 15;10(5):e0126590. doi: 10.1371/journal.pone.0126590. eCollection 2015. PLoS One. 2015. PMID: 25978676 Free PMC article. - Eukaryotic core promoters and the functional basis of transcription initiation.
Haberle V, Stark A. Haberle V, et al. Nat Rev Mol Cell Biol. 2018 Oct;19(10):621-637. doi: 10.1038/s41580-018-0028-8. Nat Rev Mol Cell Biol. 2018. PMID: 29946135 Free PMC article. Review. - Bidirectional promoters in the transcription of mammalian genomes.
Orekhova AS, Rubtsov PM. Orekhova AS, et al. Biochemistry (Mosc). 2013 Apr;78(4):335-41. doi: 10.1134/S0006297913040020. Biochemistry (Mosc). 2013. PMID: 23590436 Review.
Cited by
- RNAP-II molecules participate in the anchoring of the ORC to rDNA replication origins.
Mayan MD. Mayan MD. PLoS One. 2013;8(1):e53405. doi: 10.1371/journal.pone.0053405. Epub 2013 Jan 4. PLoS One. 2013. PMID: 23308214 Free PMC article. - Shaking up the silence: consequences of HMGN1 antagonizing PRC2 in the Down syndrome brain.
Farley SJ, Grishok A, Zeldich E. Farley SJ, et al. Epigenetics Chromatin. 2022 Dec 3;15(1):39. doi: 10.1186/s13072-022-00471-6. Epigenetics Chromatin. 2022. PMID: 36463299 Free PMC article. Review. - Long span DNA paired-end-tag (DNA-PET) sequencing strategy for the interrogation of genomic structural mutations and fusion-point-guided reconstruction of amplicons.
Yao F, Ariyaratne PN, Hillmer AM, Lee WH, Li G, Teo AS, Woo XY, Zhang Z, Chen JP, Poh WT, Zawack KF, Chan CS, Leong ST, Neo SC, Choi PS, Gao S, Nagarajan N, Thoreau H, Shahab A, Ruan X, Cacheux-Rataboul V, Wei CL, Bourque G, Sung WK, Liu ET, Ruan Y. Yao F, et al. PLoS One. 2012;7(9):e46152. doi: 10.1371/journal.pone.0046152. Epub 2012 Sep 28. PLoS One. 2012. PMID: 23029419 Free PMC article. - CBX3 regulates efficient RNA processing genome-wide.
Smallwood A, Hon GC, Jin F, Henry RE, Espinosa JM, Ren B. Smallwood A, et al. Genome Res. 2012 Aug;22(8):1426-36. doi: 10.1101/gr.124818.111. Epub 2012 Jun 8. Genome Res. 2012. PMID: 22684280 Free PMC article. - Identifying synergistic regulation involving c-Myc and sp1 in human tissues.
Parisi F, Wirapati P, Naef F. Parisi F, et al. Nucleic Acids Res. 2007;35(4):1098-107. doi: 10.1093/nar/gkl1157. Epub 2007 Jan 30. Nucleic Acids Res. 2007. PMID: 17264126 Free PMC article.
References
- Smale ST, Kadonaga JT. The RNA polymerase II core promoter. Annu Rev Biochem. 2003;72:449–79. - PubMed
- Tjian R, Maniatis T. Transcriptional activation: a complex puzzle with few easy pieces. Cell. 1994;77:5–8. - PubMed
- Reinberg D, et al. The RNA polymerase II general transcription factors: past, present, and future. Cold Spring Harb Symp Quant Biol. 1998;63:83–103. - PubMed
- Ren B, et al. Genome-wide location and function of DNA binding proteins. Science. 2000;290:2306–9. - PubMed
Publication types
MeSH terms
Substances
LinkOut - more resources
Full Text Sources
Other Literature Sources
Molecular Biology Databases


