Notch1 modulates timing of G1-S progression by inducing SKP2 transcription and p27 Kip1 degradation - PubMed (original) (raw)
Notch1 modulates timing of G1-S progression by inducing SKP2 transcription and p27 Kip1 degradation
Leonor M Sarmento et al. J Exp Med. 2005.
Abstract
Cyclin-dependent kinase inhibitors (CKIs) and Notch receptor activation have been shown to influence adult stem cells and progenitors by altering stem cell self-renewal and proliferation. Yet, no interaction between these molecular pathways has been defined. Here we show that ligand-independent and ligand-dependent activation of Notch1 induces transcription of the S phase kinase-associated protein 2 (SKP2), the F-box subunit of the ubiquitin-ligase complex SCF(SKP2) that targets proteins for degradation. Up-regulation of SKP2 by Notch signaling enhances proteasome-mediated degradation of the CKIs, p27 Kip1 and p21 Cip1, and causes premature entry into S phase. Silencing of SKP2 by RNA interference in G1 stabilizes p27 Kip1 and p21 Cip1 and abolishes Notch effect on G1-S progression. Thus, SKP2 serves to link Notch1 activation with the cell cycle machinery. This novel pathway involving Notch/SKP2/CKIs connects a cell surface receptor with proximate mediators of cell cycle activity, and suggests a mechanism by which a known physiologic mediator of cell fate determination interfaces with cell cycle control.
Figures
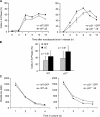
Figure 1.
Biologic effects of N1 activation on 3T3 WT and p21−/− fibroblasts. (A) Percentage of cells in S phase during cell cycle progression. The cell cycle entry of transduced 3T3 cells was evaluated by bromodeoxyuridine incorporation. Values represent an average of duplicate samples in a representative experiment. (B) Bars indicate the average percentage of cells in S phase at 6 h after nocodazole block and release in five independent experiments. The difference between GFP and ΔE populations is statistically significant. (C) Cell division kinetics. Cells stained with PKH26-GL were seeded at low density and analyzed by FACS. The line graphs show a representative experiment. Values indicate PKH 26-GL mean intensity of fluorescence (MIF), decaying over time during cells' exponential growth.
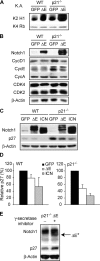
Figure 2.
N1 activation correlates with increased CDK2 kinase activity and promotes p27Kip1 down-regulation. (A) In vitro kinase activity assay (K.A.) of immunoprecipitated CDK2 (K2) or CDK4 (K4) complexes from growing cells. Histone (H1) or retinoblastoma (Rb) was used as substrate, respectively. (B) Immunoblot of cyclins and CDKs. (C) Immunoblot of p27Kip1. p21−/− cells express higher levels of p27Kip1 compared with WT, perhaps as a compensatory mechanism. In this blot, where WT and p21−/− cells are side by side, p27Kip1 in WT samples is underexposed to avoid its overexposure in p21−/− samples. (D) ImageQuant densitometric analysis of p27Kip1 protein expression. The values, an average of five independent experiments, indicate percentage of p27Kip1 protein detected in ΔE or ICN cells relative to their GFP controls (100%). (E) Cells were incubated with the GSI (+) or DMSO vehicle control (−) for 12 h. Protein extracts from harvested cells were analyzed by Western blot to assess N1 and p27Kip1 expression.
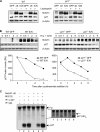
Figure 3.
N1 activation induces ubiquitin-proteasome–mediated degradation of p27Kip1. (A) Proteasome inhibition. Transduced 3T3 cells were incubated with DMSO (vehicle control) or the proteasome inhibitor, lactacystin. Cell extracts were analyzed by Western blot for p27Kip1 expression. (B) p27Kip1 protein half-life. Transduced 3T3 cells were arrested by nocodazole block. Cycloheximide was added 6 h after release into cell cycle and samples were incubated with cycloheximide for the indicated time points before lysis. p27Kip1 protein levels were determined by Western blot (top panel) and their densitometric values normalized to β-actin, densitometric units (DU) were plotted as line graphs (bottom panel). (C) In vivo detection of ubiquitin conjugates. Cell extracts from p21−/− GFP and ΔE cells treated with MG132 or DMSO, were immunoprecipitated with anti-p27Kip1 antibodies or with IgG controls, separated by SDS-PAGE and blotted with anti-p27Kip1 antibodies. The inset shows a darker exposure of the blot for detection of slowly migrating forms of p27Kip1.
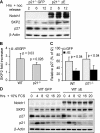
Figure 4.
N1 activation enhances SKP2 expression and p27Kip1 degradation during cell cycle progression. (A) Immunoblot of SKP2 and p27Kip1 during cell cycle progression induced by nocodazole block and release. (B) SKP2 expression at 6 h from nocodazole block and release was quantified by densitometric analysis and normalized with β-actin expression in Western blots of three independent experiments. Bars express average fold increase of SKP2 expression in ΔE cells compared with GFP. (C) Bars represent average percentage of p27Kip1 expression at 6 h relative to 2 h (100%) in four independent experiments. (D) Immunoblot of SKP2, p21Cip1, and p27Kip1 during serum-induced cell cycle progression.
Figure 5.
SKP2 is required for Notch effect on p27Kip1. (A) WT-GFP and WT-ΔE were transfected with siRNA against SKP2 or GFP (negative control) during the serum starvation-stimulation procedure. Cell extracts were obtained at each indicated time point and analyzed by Western blot. The white lines indicate that intervening lanes have been spliced out. (B) Histogram summarizes multiple experiments at 12 h after serum stimulation. SKP2, p27Kip1, and p21Cip1 protein levels were quantified from Western blot bands and normalized with β-actin values. Bars represent average densitometric units of four independent observations for GFP and ΔE cells, and two independent observations for ΔE cells in the presence of siSKP2. (*) Statistically significant differences between ΔE and GFP cells: SKP2 P = 0.015; p27Kip1 P =0.033; p21Cip1 P < 0.003. (C) Cells stimulated with serum in the absence or presence of SKP2 siRNA were pulsed with bromodeoxyuridine at 8 h and 12 h after stimulation. The difference between percentages of cells in S phase in ΔE and GFP cells were calculated. Bars represent averages of the differences expressed as percentage of S phase increment.
Figure 6.
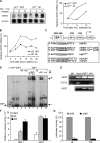
N1 activation induces CBF-1–dependent SKP2 transcription. (A) Kinetics of SKP2 mRNA induction in 3T3 cells synchronized by nocodazole block-release by Northern blot (left panel); the line graph represents percentages of SKP2 expression normalized to β-actin over time (right panel). (B) Transduced 3T3 cells were synchronized by serum starvation and stimulation and were analyzed by Northern blot; values represent percentages of SKP2 expression normalized to β-actin. (C) Identification of CBF-1 binding site in the SKP2 promoter. Top panel: representation of the human SKP2 promoter region containing CBF-1. Bottom panel: comparison of known CBF-1 binding sites in different gene promoters. (D) EMSA analysis was performed by incubating radiolabeled oligonucleotide with no extract (−) or lysates from 293T transfected with GFP or CBF-1. Radiolabeled WT oligonucleotide was incubated with lysates preincubated with 50-fold excess of unlabeled WT (wt) or mutated (mut) oligonucleotide for competition experiments (c.c.), and with unrelated antibody (αnr), anti-N1, or anti–CBF-1 antibodies for supershifts experiments. + and ++ indicate that 2.5 and 5 μl of ab were used. Specific CBF1-DNA complex is indicated as CBF1. (*) indicates the supershifted band obtained when anti–CBF-1 or anti-N1 antibodies were present in the binding mixture. (E) Binding of N1 and CBF1 to the endogenous SKP2 promoter by chromatin IP analysis. SUPT1 cells, which express high levels of activated N1, were processed for chromatin immunoprecipitation with antibodies against CBF-1, N1, or affinity purified IgGs. Input DNA and recovered DNA were analyzed by PCR using specific primers for the indicated promoters. In the Hes1 PCR, the input DNA lane is substituted by a nonimmune IP sample. Positive PCR products were generated from the input DNA. (F) Increased SKP2 and HES-1 promoter activity in the presence of activated N1. Transduced 3T3 cells were transfected with the luciferase reporter plasmid containing the 3.1-kb SKP2 promoter (SKP2-luc) or the HES-1 promoter (HES-luc). Cells were harvested after 40 h and cell extracts were prepared for the luciferase reporter assays. All promoter activity studies are representative of at least three independent experiments. (G) Deletion of CBF-1 binding motif abrogates CBF-1/N1–dependent transcription. Transduced 3T3 cells were transfected with the luciferase reporter plasmid containing the 3.1-kb SKP2 promoter (SKP2-luc) or the site specific deletion in the HES promoter (Δ-CBF1) that abrogate CBF-1/N1–dependent transcription. Cells were harvested after 40 h and cell extracts were prepared for the luciferase reporter assays. Values represent the average percentage of luciferase relative units obtained using the Δ-CBF1 construct relative to SKP2 construct (100%).
Figure 7.
Stimulation of endogenous Notch by Dll4 ligand promotes SKP2 induction in vivo. (A) N1, Notchic, SKP2, and p27Kip1 expression in undifferentiated HL-60 cells. (B) Left panel: HL-60 cells were seeded in wells coated with IgG1-Fc control fragment (Fc) or recombinant Dll4-Fc fusion protein (Dll4) and cultured in the presence of ATRA. Cell extracts obtained from cells at 48 h and 72 h of culture with Fc or Dll4 and ATRA were analyzed by Western blot using specific antibodies directed to Val 1744-cleaved form of Notch (Notchic), SKP2, p27Kip1, and β-actin. Right panel: HL-60 cells cultured for 72 h on Fc or Dll4 were incubated with GSI (+) or DMSO vehicle control (−) for an additional 24 h. The white lines indicate that intervening lanes have been spliced out. (C) Northern blot analysis of SKP2 transcripts in HL-60 cells stimulated with Dll4 or Fc fragment for 72 h. (D) HL-60 cells were induced to differentiate in the presence of either ATRA (Co) or ATRA + Dll4 stimulation in the absence or presence of GSI. At the indicated days, cells were analyzed for the expression of the differentiation marker, CD11b, by FACS. Values indicate an average of three independent experiments.
Figure 8.
Physiologic relevance of the Notch/SKP2 pathway in vivo. (A) SKP2 expression in the absence of N1. RNA obtained from BM and spleen cells of N1AS+/+ and controls were used for RT and PCR amplification for the indicated gene products. All samples were positive for the low molecular size PCR product of the housekeeping gene, GSα, which confirmed the absence of genomic DNA. Noticeable SKP2 expression was found in the spleen cells (left). Bar graph (right) represents densitometric values of SKP2 normalized with GSα (densitometric units, DU); values indicate averages of three controls and four N1AS+/+ samples (right; P = 0.064). (B–D) BM Lin− cells sorted from control mice were exposed to MS5 cells overexpressing vector alone (Co) or Dll4−/+ GSI. At day 3, cells were harvested and processed for the following: (B) PCR for SKP2 and GSα and (C) Bromodeoxyuridine incorporation. Bars indicate average percentage of cells in S phase in three independent experiments; difference between control/GSI and Dll4/GSI is not statistically significant. P = 0.1. (D) Immunophenotyping: cells were stained with anti–c-Kit antibody and analyzed by flow cytometer. Bars indicate average percentage of Lin−c-Kit+ cells in three independent experiments. *P = 0.03.
Figure 9.
Notch/SKP2/CDK pathway model. (A) In basal conditions, mitogen stimulation promotes reentry into the cell cycle by inducing SKP2 expression, which in turn, mediates p21Cip1 and p27Kip1 degradation. (B) Activation of Notch by its physiologic ligands synergies with mitogen stimulation and enforces SKP2 transcription, leading to increased degradation of p21Cip1 and p27Kip1 and to enhanced G1-S transition.
Similar articles
- Degradation of p27(Kip1) at the G(0)-G(1) transition mediated by a Skp2-independent ubiquitination pathway.
Hara T, Kamura T, Nakayama K, Oshikawa K, Hatakeyama S, Nakayama K. Hara T, et al. J Biol Chem. 2001 Dec 28;276(52):48937-43. doi: 10.1074/jbc.M107274200. Epub 2001 Oct 26. J Biol Chem. 2001. PMID: 11682478 - Inhibition of F-Box protein p45(SKP2) expression and stabilization of cyclin-dependent kinase inhibitor p27(KIP1) in vitamin D analog-treated cancer cells.
Lin R, Wang TT, Miller WH Jr, White JH. Lin R, et al. Endocrinology. 2003 Mar;144(3):749-53. doi: 10.1210/en.2002-0026. Endocrinology. 2003. PMID: 12586749 - Troglitazone induces p27Kip1-associated cell-cycle arrest through down-regulating Skp2 in human hepatoma cells.
Koga H, Harada M, Ohtsubo M, Shishido S, Kumemura H, Hanada S, Taniguchi E, Yamashita K, Kumashiro R, Ueno T, Sata M. Koga H, et al. Hepatology. 2003 May;37(5):1086-96. doi: 10.1053/jhep.2003.50186. Hepatology. 2003. PMID: 12717389 - Protein destruction: adapting roles for Cks proteins.
Harper JW. Harper JW. Curr Biol. 2001 Jun 5;11(11):R431-5. doi: 10.1016/s0960-9822(01)00253-6. Curr Biol. 2001. PMID: 11516665 Review. - Regulation of the cell cycle at the G1-S transition by proteolysis of cyclin E and p27Kip1.
Nakayama KI, Hatakeyama S, Nakayama K. Nakayama KI, et al. Biochem Biophys Res Commun. 2001 Apr 13;282(4):853-60. doi: 10.1006/bbrc.2001.4627. Biochem Biophys Res Commun. 2001. PMID: 11352628 Review.
Cited by
- Anti-cancer effects of curcumin on lung cancer through the inhibition of EZH2 and NOTCH1.
Wu GQ, Chai KQ, Zhu XM, Jiang H, Wang X, Xue Q, Zheng AH, Zhou HY, Chen Y, Chen XC, Xiao JY, Ying XH, Wang FW, Rui T, Liao YJ, Xie D, Lu LQ, Huang DS. Wu GQ, et al. Oncotarget. 2016 May 3;7(18):26535-50. doi: 10.18632/oncotarget.8532. Oncotarget. 2016. PMID: 27049834 Free PMC article. - p53, SKP2, and DKK3 as MYCN Target Genes and Their Potential Therapeutic Significance.
Chen L, Tweddle DA. Chen L, et al. Front Oncol. 2012 Nov 28;2:173. doi: 10.3389/fonc.2012.00173. eCollection 2012. Front Oncol. 2012. PMID: 23226679 Free PMC article. - Notch and Wnt signaling mediated rod photoreceptor regeneration by Müller cells in adult mammalian retina.
Del Debbio CB, Balasubramanian S, Parameswaran S, Chaudhuri A, Qiu F, Ahmad I. Del Debbio CB, et al. PLoS One. 2010 Aug 26;5(8):e12425. doi: 10.1371/journal.pone.0012425. PLoS One. 2010. PMID: 20865053 Free PMC article. - Differential expression of Notch1 intracellular domain and p21 proteins, and their clinical significance in gastric cancer.
Luo DH, Zhou Q, Hu SK, Xia YQ, Xu CC, Lin TS, Pan YT, Wu JS, Jin R. Luo DH, et al. Oncol Lett. 2014 Feb;7(2):471-478. doi: 10.3892/ol.2013.1751. Epub 2013 Dec 11. Oncol Lett. 2014. PMID: 24396472 Free PMC article. - Short hairpin RNA targeting Notch2 inhibits U87 human glioma cell proliferation by inducing cell cycle arrest and apoptosis in vitro and in vivo.
Li X, He X, Tian W, Wang J. Li X, et al. Mol Med Rep. 2014 Dec;10(6):2843-50. doi: 10.3892/mmr.2014.2661. Epub 2014 Oct 15. Mol Med Rep. 2014. PMID: 25323114 Free PMC article.
References
- Artavanis-Tsakonas, S., M.D. Rand, and R.J. Lake. 1999. Notch signaling: cell fate control and signal integration in development. Science. 284:770–776. - PubMed
- De Strooper, B., W. Annaert, P. Cupers, P. Saftig, K. Craessaerts, J.S. Mumm, E.H. Schroeter, V. Schrijvers, M.S. Wolfe, W.J. Ray, et al. 1999. A presenilin-1-dependent gamma-secretase-like protease mediates release of Notch intracellular domain. Nature. 398:518–522. - PubMed
- Davis, R.L., and D.L. Turner. 2001. Vertebrate hairy and Enhancer of split related proteins: transcriptional repressors regulating cellular differentiation and embryonic patterning. Oncogene. 20:8342–8357. - PubMed
- Stier, S., T. Cheng, D. Dombkowski, N. Carlesso, and D.T. Scadden. 2002. Notch1 activation increases hematopoietic stem cell self-renewal in vivo and favors lymphoid over myeloid lineage outcome. Blood. 99:2369–2378. - PubMed
Publication types
MeSH terms
Substances
LinkOut - more resources
Full Text Sources
Molecular Biology Databases
Miscellaneous
