Selection strength and hitchhiking around two anti-malarial resistance genes - PubMed (original) (raw)
Comparative Study
Selection strength and hitchhiking around two anti-malarial resistance genes
Denae Nash et al. Proc Biol Sci. 2005.
Abstract
Neutral mutations may hitchhike to high frequency when they are situated close to sites under positive selection, generating local reductions in genetic diversity. This process is thought to be an important determinant of levels of genomic variation in natural populations. The size of genome regions affected by genetic hitchhiking is expected to be dependent on the strength of selection, but there is little empirical data supporting this prediction. Here, we compare microsatellite variation around two drug resistance genes (chloroquine resistance transporter (pfcrt), chromosome 7, and dihydrofolate reductase (dhfr), chromosome 4) in malaria parasite populations exposed to strong (Thailand) or weak selection (Laos) by anti-malarial drugs. In each population, we examined the point mutations underlying resistance and length variation at 22 (chromosome 4) or 25 (chromosome 7) microsatellite markers across these chromosomes. All parasites from Thailand carried the K76T mutation in pfcrt conferring resistance to chloroquine (CQ) and 2-4 mutations in dhfr conferring resistance to pyrimethamine. By contrast, we found both wild-type and resistant alleles at both genes in Laos. There were dramatic differences in the extent of hitchhiking in the two countries. The size of genome regions affected was smaller in Laos than in Thailand. We observed significant reduction in variation relative to sensitive parasites for 34-64 kb (2-4 cM) in Laos on chromosome 4, compared with 98-137 kb (6-8 cM) in Thailand. Similarly, on chromosome 7, we observed reduced variation for 34-69 kb (2-4 cM) around pfcrt in Laos, but for 195-268 kb (11-16 cM) in Thailand. Reduction in genetic variation was also less extreme in Laos than in Thailand. Most loci were monomorphic in a 12 kb region surrounding both genes on resistant chromosomes from Thailand, whereas in Laos, even loci immediately proximal to selective sites showed some variation on resistant chromosomes. Finally, linkage disequilibrium (LD) decayed more rapidly around resistant pfcrt and dhfr alleles from Laos than from Thailand. These results demonstrate that different realizations of the same selective sweeps may vary considerably in size and shape, in a manner broadly consistent with selection history. From a practical perspective, genomic regions containing resistance genes may be most effectively located by genome-wide association in populations exposed to strong drug selection. However, the lower levels of LD surrounding resistance alleles in populations under weak selection may simplify identification of functional mutations.
Figures
Figure 1
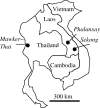
Map showing sample collection sites in Thailand and Laos.
Figure 2
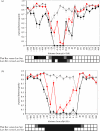
Patterns of genetic variation around pfcrt and dhfr. (a) and (b) show _H_e (±1 s.d.) plotted against position on the chromosomes relative to pfcrt (chromosome 7) and dhfr (chromosome 4). The markers are ordered along the _x_-axis, which is not linear. Chromosomes bearing wild-type alleles are shown in grey, those bearing resistant alleles are shown in red (Laos) or black (Thailand). The distance from pfcrt and dhfr at which _H_e differs significantly (p<0.01) between wild-type and resistant chromosomes is shown in the bars underneath the graph. Significance values were derived by permutation: black, p<0.001; stippled, p<0.01.
Figure 3
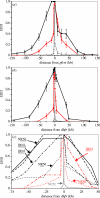
Decline in linkage disequilibrium around pfcrt and dhfr. (a) and (b) show the decline in LD around wild-type and resistant alleles at pfcrt and dhfr. The _x_-axes are shown to scale. In (b), resistant alleles bearing between one and four mutations are grouped. These graphs are shown with the _x_-axis drawn to scale. LD is measured using EHH (±1 s.d.). (c) EHH plotted around dhfr alleles bearing different resistance mutations. EHH surrounding resistant alleles from Thailand is shown in black and those from Laos in red, while EHH decay around sensitive alleles is shown in grey. Four-letter codes indicate amino acids present at positions 51, 59, 108 and 164, while underlined letters are those underlying resistance. These codes are marked on the graph for clarity. Data describing EHH decline are not shown for the NCNI allele, as there were only three parasites carrying this allele.
Similar articles
- A selective sweep driven by pyrimethamine treatment in southeast asian malaria parasites.
Nair S, Williams JT, Brockman A, Paiphun L, Mayxay M, Newton PN, Guthmann JP, Smithuis FM, Hien TT, White NJ, Nosten F, Anderson TJ. Nair S, et al. Mol Biol Evol. 2003 Sep;20(9):1526-36. doi: 10.1093/molbev/msg162. Epub 2003 Jun 27. Mol Biol Evol. 2003. PMID: 12832643 - Reduced heterozygosity at intragenic and flanking microsatellites of pfcrt gene establishes natural selection based molecular evolution of chloroquine-resistant Plasmodium falciparum in India.
Mallick PK, Singh R, Singh OP, Singh AK, Bhasin VK, Valecha N. Mallick PK, et al. Infect Genet Evol. 2013 Dec;20:407-12. doi: 10.1016/j.meegid.2013.10.001. Epub 2013 Oct 12. Infect Genet Evol. 2013. PMID: 24126360 - Analyses of genetic variations at microsatellite loci present in-and-around the Pfcrt gene in Indian Plasmodium falciparum.
Chauhan K, Pande V, Das A. Chauhan K, et al. Infect Genet Evol. 2013 Dec;20:476-87. doi: 10.1016/j.meegid.2013.10.010. Epub 2013 Oct 21. Infect Genet Evol. 2013. PMID: 24157593 - pfcrt is more than the Plasmodium falciparum chloroquine resistance gene: a functional and evolutionary perspective.
Cooper RA, Hartwig CL, Ferdig MT. Cooper RA, et al. Acta Trop. 2005 Jun;94(3):170-80. doi: 10.1016/j.actatropica.2005.04.004. Acta Trop. 2005. PMID: 15866507 Review. - [Mechanisms and dynamics of drug resistance in Plasmodium falciparum].
Le Bras J. Le Bras J. Bull Soc Pathol Exot. 1999 Sep-Oct;92(4):236-41. Bull Soc Pathol Exot. 1999. PMID: 10572658 Review. French.
Cited by
- ARHGAP18 is a novel gene under positive natural selection that influences HbF levels in β-thalassaemia.
He Y, Luo J, Chen Y, Zhou X, Yu S, Jin L, Xiao X, Jia S, Liu Q. He Y, et al. Mol Genet Genomics. 2018 Feb;293(1):207-216. doi: 10.1007/s00438-017-1377-2. Epub 2017 Oct 5. Mol Genet Genomics. 2018. PMID: 28983712 - Persistence of Sulfadoxine-Pyrimethamine Resistance Despite Reduction of Drug Pressure in Malawi.
Artimovich E, Schneider K, Taylor TE, Kublin JG, Dzinjalamala FK, Escalante AA, Plowe CV, Laufer MK, Takala-Harrison S. Artimovich E, et al. J Infect Dis. 2015 Sep 1;212(5):694-701. doi: 10.1093/infdis/jiv078. Epub 2015 Feb 11. J Infect Dis. 2015. PMID: 25672905 Free PMC article. - Genetic architecture of resistance in Daphnia hosts against two species of host-specific parasites.
Routtu J, Ebert D. Routtu J, et al. Heredity (Edinb). 2015 Feb;114(2):241-8. doi: 10.1038/hdy.2014.97. Epub 2014 Oct 22. Heredity (Edinb). 2015. PMID: 25335558 Free PMC article. - Local adaptation and vector-mediated population structure in Plasmodium vivax malaria.
Joy DA, Gonzalez-Ceron L, Carlton JM, Gueye A, Fay M, McCutchan TF, Su XZ. Joy DA, et al. Mol Biol Evol. 2008 Jun;25(6):1245-52. doi: 10.1093/molbev/msn073. Epub 2008 Apr 2. Mol Biol Evol. 2008. PMID: 18385220 Free PMC article. - Differences in selective pressure on dhps and dhfr drug resistant mutations in western Kenya.
McCollum AM, Schneider KA, Griffing SM, Zhou Z, Kariuki S, Ter-Kuile F, Shi YP, Slutsker L, Lal AA, Udhayakumar V, Escalante AA. McCollum AM, et al. Malar J. 2012 Mar 22;11:77. doi: 10.1186/1475-2875-11-77. Malar J. 2012. PMID: 22439637 Free PMC article.
References
- Anderson T.J. Mapping drug resistance genes in Plasmodium falciparum by genome-wide association. Curr. Drug Targets Infect. Disord. 2004;4:65–78. - PubMed
- Anderson T.J, Su X.Z, Bockarie M, Lagog M, Day K.P. Twelve microsatellite markers for characterization of Plasmodium falciparum from finger-prick blood samples. Parasitology. 1999;119:113–125. - PubMed
- Anderson T.J, et al. Microsatellite markers reveal a spectrum of population structures in the malaria parasite Plasmodium falciparum. Mol. Biol. Evol. 2000;17:1467–1482. - PubMed
- Anderson T.J, Nair S, Jacobzone C, Zavai A, Balkan S. Molecular assessment of drug resistance in Plasmodium falciparum from Bahr El Gazal province, Sudan. Trop. Med. Int. Health. 2003;8:1068–1073. - PubMed
Publication types
MeSH terms
Substances
LinkOut - more resources
Full Text Sources
Other Literature Sources
Research Materials


