The Rho kinases I and II regulate different aspects of myosin II activity - PubMed (original) (raw)
The Rho kinases I and II regulate different aspects of myosin II activity
Atsuko Yoneda et al. J Cell Biol. 2005.
Abstract
The homologous mammalian rho kinases (ROCK I and II) are assumed to be functionally redundant, based largely on kinase construct overexpression. As downstream effectors of Rho GTPases, their major substrates are myosin light chain and myosin phosphatase. Both kinases are implicated in microfilament bundle assembly and smooth muscle contractility. Here, analysis of fibroblast adhesion to fibronectin revealed that although ROCK II was more abundant, its activity was always lower than ROCK I. Specific reduction of ROCK I by siRNA resulted in loss of stress fibers and focal adhesions, despite persistent ROCK II and guanine triphosphate-bound RhoA. In contrast, the microfilament cytoskeleton was enhanced by ROCK II down-regulation. Phagocytic uptake of fibronectin-coated beads was strongly down-regulated in ROCK II-depleted cells but not those lacking ROCK I. These effects originated in part from distinct lipid-binding preferences of ROCK pleckstrin homology domains. ROCK II bound phosphatidylinositol 3,4,5P(3) and was sensitive to its levels, properties not shared by ROCK I. Therefore, endogenous ROCKs are distinctly regulated and in turn are involved with different myosin compartments.
Figures
Figure 1.
Activity profiles of ROCK I and II in fibroblast adhesion. (A) Serum-starved REF were plated on FN-coated plates and lysates were prepared at times up to 3 h. GTP-RhoA was pulled down with GST-Rhotekin–immobilized beads. RhoA protein levels in total cell lysate and pull down samples were calculated from Western blots and relative GTP-RhoA levels were normalized to time 0. Error bars show SD. (B) ROCK I and II immunoprecipitates and total cell lysates were subjected to SDS-PAGE and Western blotting with ROCK antibodies. Each antibody is monospecific and only recognizes one ROCK protein. (C) ROCK I and II and actin protein levels in cell lysate from REF plated on FN for the indicated times were analyzed by Western blotting. No changes through cell adhesion were seen. (D) ROCK I and II were specifically immunoprecipitated from lysates at the indicated times in fibroblast adhesion on FN. Kinase activities in immunoprecipitates were analyzed with GST-MLC as substrate. Background radiolabel levels from negative control precipitates were subtracted and the data was normalized to ROCK protein levels in the immunoprecipitates. Error bars show SD.
Figure 2.
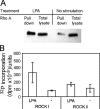
Rho kinase activity in relation to microfilament bundle formation. (A and B) Serum-starved REF were stimulated with 400 ng/ml LPA or control buffer for 5 min and lysed. (A) GTP-RhoA was pulled down from cell lysates and analyzed by Western blotting. One example from duplicate experiments is shown, with increased levels of GTP-RhoA after LPA treatment. (B) Each ROCK was specifically immunoprecipitated, and kinase activities in immunoprecipitates were analyzed as described in Materials and methods. Means of duplicates are shown. Whereas ROCK I activity was enhanced by LPA treatment, that of ROCK II was little changed.
Figure 3.
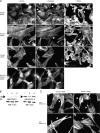
ROCK I but not ROCK II activity is essential for focal adhesion and stress fiber formation. (A) Fibroblast cultures were transfected with ROCK I, ROCK II, negative control, or a mixture of ROCK I and II siRNA duplexes. After maintenance culture for 2 d, cells were fixed and stained for paxillin and F-actin. Arrowheads indicate transfected cells. 2 d after transfection with siRNA duplexes, REF were incubated with Y-27632 (10 μM) in the presence of FCS. After 30 min, cells were fixed and stained for F-actin. In all cases, stress fibers were sensitive to Y-27632 addition. (B) Total cell lysates of REF prepared 2 d after transfection with ROCK I (I), ROCK II (II), or control (C) siRNA duplexes were analyzed by Western blotting for ROCK I, ROCK II, and actin. In each case, total populations were analyzed, containing some nontransfected cells. Results from cultures where 80–90% of cells were transfected are shown. (C) REF were cotransfected with myc-tagged full-length human ROCK I or bovine ROCK II cDNA and cy3-labeled ROCK I or II siRNA duplexes. 2 d after transfection, cells were fixed and stained for myc and F-actin. Either ROCK cDNA can restore a normal phenotype. Arrowheads indicate cotransfected cells. Bars, 50 μm.
Figure 4.
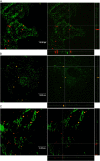
ROCK II–deficient fibroblasts have low phagocytic activity. REF transfected with ROCK I (A), ROCK II (B), and control (C) siRNA were analyzed for phagocytic activity with FN-coated latex red beads as described in Materials and methods. After a 1-h incubation with beads, the cells were fixed and stained for extracellular FN. Three-dimensional fluorescence images of FN (green) and latex beads (red) were recorded from laser scanning confocal microscopy. Intracellular, phagocytosed beads could be seen as red only, whereas beads remaining extracellularly could be detected in both red and green channels. Quantitation is shown in Table I.
Figure 5.
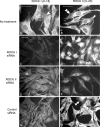
Endogenous ROCK I and II have distinct distributions. (A) ROCK I in REF cells is largely diffuse in the cytoplasm, more concentrated in perinuclear regions, and sometimes associated with stress fibers (arrowhead). It is not membrane associated unlike ROCK II (B; double arrowheads). ROCK II is also intensely concentrated in perinuclear regions (B, D, and H). After siRNA treatment to deplete ROCK I, its staining is correspondingly reduced (C), whereas that of ROCK II is unaltered (D). Reciprocal results are seen with ROCK II depletion (E and F). Control siRNA treatment was without effect on either rho kinase staining pattern (G and H). Bars, 50 μm.
Figure 6.
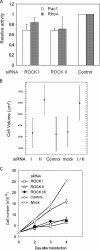
ROCK I– and II–deficient cells contain normal GTPase profiles but are growth retarded. (A) 2 d after siRNA duplex transfection, GTP-RhoA and GTP-Rac1 were analyzed by pull-down assays. Levels are normalized to negative control levels, and error bars indicate SD. In all cases, levels were close to those of control cells. (B) 2 d after transfection with siRNA duplexes, diameters of rounded cells were measured and volumes were calculated as described in Materials and methods. Data were analyzed by one-way ANOVA and showed that cells depleted of ROCK II were significantly larger than control, mock-transfected, or ROCK I–depleted cells (P < 0.001). Double depleted cells were similar to cells depleted of ROCK II alone. (C) At the indicated days after transfection, cell numbers were counted. Error bars show SD. In all cases, control transfections are luciferase DNA target duplexes, whereas mock cultures received oligofectamine only.
Figure 7.
ROCKs can phosphorylate the same substrates. (A) ROCK I and II immunoprecipitates from REF were incubated with MBP-MYPT1 COOH-terminal fragment and γ-[32P]ATP. Background radiolabel levels from control immunoprecipitates have been deducted. (B) 2 d after transfection with siRNA duplexes, cells were fixed and stained for pMLC2 (Ser19) and F-actin. ROCK I siRNA cells have depleted staining, whereas the abundant stress fibers of ROCK II siRNA stain strongly. Bar, 50 μm. (C and D) Total cell lysates from REF treated with Y-27632 in the presence of serum were analyzed by Western blotting for MLC2 phosphorylation on Ser19 (p-MLC) or Thr18/Ser19 (pp-MLC) (C) and MYPT phosphorylation on Thr853 or Thr696 (D). Although MYPT phosphorylation on Thr853 was reduced, more marked reductions were seen in MLC2 phosphorylation after Rho kinase inhibition. (E and F) Total cell lysates from cells transfected with siRNA duplexes were analyzed by Western blotting for MLC2 phosphorylation on Thr18/Ser19 (E) and MYPT phosphorylation of Thr853 or Thr696 (F). Phosphorylation is normalized to the relevant protein level in the lysates. Phosphorylation levels of MYPT were increased in the absence of ROCK I, partly due to a decrease in myosin phosphatase protein levels in these cells. Error bars show SD.
Figure 8.
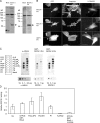
ROCK I and II PH domains do not bind the same PIs. (A) COS7 cells were transfected with ROCK I- or ROCK II-PH-GFP cDNA. After 24 h of transfection, total cell lysates were analyzed by Western blotting with ROCK antibodies. Asterisks show endogenous ROCK proteins and arrowheads indicate ROCK-PH-GFP proteins. (B) Fibroblasts were transfected with ROCK I- or ROCK II-PH-GFP or GRP1-PH-GFP cDNA. 1 d after transfection, cells were fixed and stained for F-actin. In other cases, transfectants were incubated with 30 μM LY294002 for 60 min in the presence of serum and fixed. Arrowheads indicate cell margins with ruffles prominently containing ROCK II and GRP1-PH domains. These structures are absent after PI-3 kinase inhibition. Bar, 50 μm. (C) GST-ROCK I-PH, GST-ROCK II-PH (3.3 nM), and α-actinin (10 nM) were incubated with phospholipid-loaded nitrocellulose membranes. Bound proteins were detected with ROCK or α-actinin antibodies as appropriate. Shown underneath each blot are calibrations where known amounts of each protein were spotted onto nitrocellulose membranes and probed similarly with antibodies. Different binding profiles of ROCK I and II are evident. (D) Recombinant myc-tagged ROCK II was purified from COS-7 cells (high salt method) and the kinase activity was analyzed in the presence of GTPγS GST-RhoA (1 μM), PIs (100 μM), or Y-27632 (1 μM). Error bars show SD.
Figure 9.
ROCK II activity is regulated by PI-3 kinase. (A) Serum-starved REF were trypsinized and incubated with 10 μM LY294002 or DMSO for 30 min at 37°C. ROCK immunoprecipitates were incubated with MBP-MYPT1 COOH-terminal fragment and γ-[32P]ATP. Background radiolabel levels from control immunoprecipitates have been deducted. ROCK activities from REF treated with DMSO was indicated as one. (B) REF was cotransfected with p110α and pEGFP-N1. 1 d after transfection, cells were fixed and stained for ROCK I or II. Double arrowheads indicate transfected cells and the single arrowhead shows the localization of ROCK II in membrane ruffles. (C) ROCK immunoprecipitates from REF transfected with p110α or control vector were incubated with GST-MLC and γ-[32P]ATP, and the ROCK activities were measured. Activity of mock transfections is indicated as one. Bar, 10 μm.
Similar articles
- Fibronectin matrix assembly requires distinct contributions from Rho kinases I and -II.
Yoneda A, Ushakov D, Multhaupt HA, Couchman JR. Yoneda A, et al. Mol Biol Cell. 2007 Jan;18(1):66-75. doi: 10.1091/mbc.e06-08-0684. Epub 2006 Oct 25. Mol Biol Cell. 2007. PMID: 17065553 Free PMC article. - Multiple downstream signalling pathways from ROCK, a target molecule of Rho small G protein, in reorganization of the actin cytoskeleton in Madin-Darby canine kidney cells.
Takaishi K, Matozaki T, Nakano K, Takai Y. Takaishi K, et al. Genes Cells. 2000 Nov;5(11):929-936. doi: 10.1046/j.1365-2443.2000.00377.x. Genes Cells. 2000. PMID: 11122380 - Myosin phosphatase targeting subunit 1 affects cell migration by regulating myosin phosphorylation and actin assembly.
Xia D, Stull JT, Kamm KE. Xia D, et al. Exp Cell Res. 2005 Apr 1;304(2):506-17. doi: 10.1016/j.yexcr.2004.11.025. Epub 2004 Dec 30. Exp Cell Res. 2005. PMID: 15748895 - Role of myosin light chain phosphorylation in the regulation of cytokinesis.
Matsumura F, Totsukawa G, Yamakita Y, Yamashiro S. Matsumura F, et al. Cell Struct Funct. 2001 Dec;26(6):639-44. doi: 10.1247/csf.26.639. Cell Struct Funct. 2001. PMID: 11942620 Review. - Regulation of myosin II during cytokinesis in higher eukaryotes.
Matsumura F. Matsumura F. Trends Cell Biol. 2005 Jul;15(7):371-7. doi: 10.1016/j.tcb.2005.05.004. Trends Cell Biol. 2005. PMID: 15935670 Review.
Cited by
- Regulation of ROCK activity in cancer.
Morgan-Fisher M, Wewer UM, Yoneda A. Morgan-Fisher M, et al. J Histochem Cytochem. 2013 Mar;61(3):185-98. doi: 10.1369/0022155412470834. Epub 2012 Nov 29. J Histochem Cytochem. 2013. PMID: 23204112 Free PMC article. Review. - Chemical screening identifies ROCK1 as a regulator of migrasome formation.
Lu P, Liu R, Lu D, Xu Y, Yang X, Jiang Z, Yang C, Yu L, Lei X, Chen Y. Lu P, et al. Cell Discov. 2020 Aug 4;6(1):51. doi: 10.1038/s41421-020-0179-6. eCollection 2020. Cell Discov. 2020. PMID: 32802402 Free PMC article. No abstract available. - A collapsin response mediator protein 2 isoform controls myosin II-mediated cell migration and matrix assembly by trapping ROCK II.
Yoneda A, Morgan-Fisher M, Wait R, Couchman JR, Wewer UM. Yoneda A, et al. Mol Cell Biol. 2012 May;32(10):1788-804. doi: 10.1128/MCB.06235-11. Epub 2012 Mar 19. Mol Cell Biol. 2012. PMID: 22431514 Free PMC article. - Distinct roles for ROCK1 and ROCK2 in the regulation of cell detachment.
Shi J, Wu X, Surma M, Vemula S, Zhang L, Yang Y, Kapur R, Wei L. Shi J, et al. Cell Death Dis. 2013 Feb 7;4(2):e483. doi: 10.1038/cddis.2013.10. Cell Death Dis. 2013. PMID: 23392171 Free PMC article. - Toll‑Like receptor 4 promotes the phosphorylation of CRMP2 via the activation of Rho‑kinase in MCAO rats.
Li XB, Ding MX, Ding CL, Li LL, Feng J, Yu XJ. Li XB, et al. Mol Med Rep. 2018 Jul;18(1):342-348. doi: 10.3892/mmr.2018.8968. Epub 2018 May 3. Mol Med Rep. 2018. PMID: 29749502 Free PMC article.
References
- Amano, M., M. Ito, K. Kimura, Y. Fukata, K. Chihara, T. Nakano, Y. Matsuura, and K. Kaibuchi. 1996. Phosphorylation and activation of myosin by Rho-associated kinase (Rho-kinase). J. Biol. Chem. 271:20246–20249. - PubMed
- Araki, N., T. Hatae, A. Furukawa, and J.A. Swanson. 2003. Phosphoinositide-3-kinase-independent contractile activities associated with Fcgamma-receptor-mediated phagocytosis and macropinocytosis in macrophages. J. Cell Sci. 116:247–257. - PubMed
- Begum, N., O.A. Sandu, M. Ito, S.M. Lohmann, and A. Smolenski. 2002. Active rho kinase (ROK-α) associates with insulin receptor substrate-1 and inhibits insulin signaling in vascular smooth muscle cells. J. Biol. Chem. 277:6214–6222. - PubMed
- Chen, X.-Q., I. Tan, C.H. Ng, C. Hall, L. Lim, and T. Leung. 2002. Characterization of RhoA-binding kinase ROKα implication of the pleckstrin homology domain in ROKα function using region-specific antibodies. J. Biol. Chem. 277:12680–12688. - PubMed
Publication types
MeSH terms
Substances
LinkOut - more resources
Full Text Sources
Other Literature Sources
Research Materials

