Epidemiological evidence of an early wave of the 1918 influenza pandemic in New York City - PubMed (original) (raw)
Epidemiological evidence of an early wave of the 1918 influenza pandemic in New York City
Donald R Olson et al. Proc Natl Acad Sci U S A. 2005.
Abstract
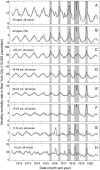
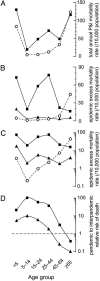
The 1918 "Spanish flu" was the fastest spreading and most deadly influenza pandemic in recorded history. Hypotheses of its origin have been based on a limited collection of case and outbreak reports from before its recognized European emergence in the summer of 1918. These anecdotal accounts, however, remain insufficient for determining the early diffusion and impact of the pandemic virus. Using routinely collected monthly age-stratified mortality data, we show that an unmistakable shift in the age distribution of epidemic deaths occurred during the 1917/1918 influenza season in New York City. The timing, magnitude, and age distribution of this mortality shift provide strong evidence that an early wave of the pandemic virus was present in New York City during February-April 1918.
Figures
Fig. 1.
All-cause and P&I monthly mortality rates for all ages (A and B) and all-cause mortality rates by age group (_C_-H) are calculated per 10,000 population. Observed rates are days-per-month adjusted. Expected model baselines (solid lines) are derived from each series of nonepidemic months. Epidemic thresholds (dashed lines) are the upper 95% confidence limit above each baseline. The major epidemic influenza season months are indicated (shaded). Two 1917/1918 influenza season peaks (arrowheads) show excess mortality primarily confined to the ≥65-years age group in January (C), and to the groups <45 years old in March 1918 (_E_-H). Other severe mortality events are evident: summer diarrheal disease epidemics were confined to young children (H), the 1916 polio epidemic to all children (G and H), and the summer 1917 heat wave and diarrheal disease epidemic among the youngest and oldest age groups (C and H).
Fig. 2.
Annual and epidemic period mortality rates by age group. (A) Average age-specific calendar year P&I death rates are plotted in a U-shaped age distribution for 1915-1917 (○), and in the characteristic W-shaped distribution for the pandemic year 1918 (▪). (B) Influenza-season-attributable excess deaths are plotted for the 1915/1916 epidemic influenza season (○), the epidemic months March and April 1918 (▴), and the pandemic season from September 1918 through April 1919 (▪). (C) The excess rates are plotted on a log10 scale. (D) Relative risk of death is plotted by age group on a log10 scale for the March and April 1918 epidemic period (▴) and the pandemic from September 1918 through April 1919 (▪) relative to the severe 1915/1916 epidemic season.
Similar articles
- Epidemiologic characterization of the 1918 influenza pandemic summer wave in Copenhagen: implications for pandemic control strategies.
Andreasen V, Viboud C, Simonsen L. Andreasen V, et al. J Infect Dis. 2008 Jan 15;197(2):270-8. doi: 10.1086/524065. J Infect Dis. 2008. PMID: 18194088 Free PMC article. - The 1918 influenza pandemic in New York City: age-specific timing, mortality, and transmission dynamics.
Yang W, Petkova E, Shaman J. Yang W, et al. Influenza Other Respir Viruses. 2014 Mar;8(2):177-88. doi: 10.1111/irv.12217. Epub 2013 Dec 2. Influenza Other Respir Viruses. 2014. PMID: 24299150 Free PMC article. - Excess deaths and immunoprotection during 1918-1920 influenza pandemic, Taiwan.
Hsieh YH. Hsieh YH. Emerg Infect Dis. 2009 Oct;15(10):1617-9. doi: 10.3201/eid1510.080811. Emerg Infect Dis. 2009. PMID: 19861055 Free PMC article. - [Influenza virus].
Juozapaitis M, Antoniukas L. Juozapaitis M, et al. Medicina (Kaunas). 2007;43(12):919-29. Medicina (Kaunas). 2007. PMID: 18182834 Review. Lithuanian. - The 1918 influenza pandemic: lessons for 2009 and the future.
Morens DM, Taubenberger JK, Harvey HA, Memoli MJ. Morens DM, et al. Crit Care Med. 2010 Apr;38(4 Suppl):e10-20. doi: 10.1097/CCM.0b013e3181ceb25b. Crit Care Med. 2010. PMID: 20048675 Free PMC article. Review.
Cited by
- Mortality from the influenza pandemic of 1918-19 in Indonesia.
Chandra S. Chandra S. Popul Stud (Camb). 2013 Jul;67(2):185-93. doi: 10.1080/00324728.2012.754486. Epub 2013 Jan 23. Popul Stud (Camb). 2013. PMID: 23339482 Free PMC article. - Conference Report: LPMHealthcare Emerging Viruses 2023 (EVOX23): Pandemics-Learning from the Past and Present to Prepare for the Future.
Jenkins F, Mapulanga T, Thapa G, da Costa KAS, Temperton NJ. Jenkins F, et al. Pathogens. 2024 Aug 10;13(8):679. doi: 10.3390/pathogens13080679. Pathogens. 2024. PMID: 39204279 Free PMC article. - 1951 influenza epidemic, England and Wales, Canada, and the United States.
Viboud C, Tam T, Fleming D, Miller MA, Simonsen L. Viboud C, et al. Emerg Infect Dis. 2006 Apr;12(4):661-8. doi: 10.3201/eid1204.050695. Emerg Infect Dis. 2006. PMID: 16704816 Free PMC article. - The beginning and ending of a respiratory viral pandemic-lessons from the Spanish flu.
Brüssow H. Brüssow H. Microb Biotechnol. 2022 May;15(5):1301-1317. doi: 10.1111/1751-7915.14053. Epub 2022 Mar 22. Microb Biotechnol. 2022. PMID: 35316560 Free PMC article. - Gradual changes in the age distribution of excess deaths in the years following the 1918 influenza pandemic in Copenhagen: using epidemiological evidence to detect antigenic drift.
Saglanmak N, Andreasen V, Simonsen L, Mølbak K, Miller MA, Viboud C. Saglanmak N, et al. Vaccine. 2011 Jul 22;29 Suppl 2(Suppl 2):B42-8. doi: 10.1016/j.vaccine.2011.02.065. Vaccine. 2011. PMID: 21757103 Free PMC article.
References
- Glezen, W. P. (1996) Epidemiol. Rev. 18, 64-76. - PubMed
- Johnson, N. P. A. S. & Müller, J. (2002) Bull. Hist. Med. 76, 105-115. - PubMed
- Reid, A. H. & Taubenberger, J. K. (2003) J. Gen. Virol. 84, 2285-2292. - PubMed
- Jordan, E. O. (1927) Epidemic Influenza: A Survey (Am. Med. Assoc., Chicago).
- Taubenberger, J. K., Reid, A. H., Krafft, A. E., Bijwaard, K. E. & Fanning, T. G. (1997) Science 275, 1793-1796. - PubMed
Publication types
MeSH terms
LinkOut - more resources
Full Text Sources
Medical
Miscellaneous

