Intrinsic functional dysregulation of CD4 T cells occurs rapidly following persistent viral infection - PubMed (original) (raw)
Intrinsic functional dysregulation of CD4 T cells occurs rapidly following persistent viral infection
David G Brooks et al. J Virol. 2005 Aug.
Abstract
Effective T-cell responses are critical to eradicate acute viral infections and prevent viral persistence. Emerging evidence indicates that robust, early CD4 T-cell responses are important in effectively sustaining CD8 T-cell activity. Herein, we illustrate that virus-specific CD4 T cells are functionally inactivated early during the transition into viral persistence and fail to produce effector cytokines (i.e., interleukin-2 and tumor necrosis factor alpha), thereby compromising an efficient and effective antiviral immune response. Mechanistically, the inactivation occurs at the cellular level and is not an active process maintained by regulatory T cells or antigen-presenting cells. Importantly, a small subpopulation of cells is able to resist inactivation and persist into the chronic phase of infection. However, the virus-specific CD4 T-cell population ultimately undergoes a second round of inactivation, and the cells that had retained functional capacity fail to respond to rechallenge in an acute time frame. Based on these results we propose a biological mechanism whereby early CD4 T-cell inactivation leads to a subsequent inability to sustain cytotoxic T-lymphocyte function, which in turn facilitates viral persistence. Moreover, these studies are likely relevant to chronic/persistent infections of humans (e.g., human immunodeficiency virus, hepatitis C virus, and hepatitis B virus) by providing evidence that a reservoir of virus-specific CD4 T cells can remain functional during chronic infection and represent a potential therapeutic target to stimulate the immune response and establish control of infection.
Figures
FIG. 1.
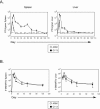
Kinetics of viral clearance and the LCMV-specific CD4 T-cell response. (A) Spleen and liver tissues were isolated from LCMV Armstrong-infected (ARM) or LCMV Clone 13-infected (Cl 13) animals at the indicated days postinfection, and the titers of infectious virus were determined by plaque assay. Data are expressed as PFU per gram of tissue. The dashed line represents the lower limit of detection, which is 200 PFU/gram of tissue. Each time point represents the average ± standard deviation (SD) of three mice per group. (B) The kinetics of the SMARTA T-cell response. A total of 104 SMARTA cells were transferred into C57BL/6 mice that were subsequently infected with Armstrong (ARM) or Clone 13 (Cl 13). Spleen (left panel) and liver (right panel) cells were isolated at the indicated days postinfection, and the absolute number of SMARTA cells in each organ was determined. Values represent the average ± SD of three mice at each time point and are representative of at least two experiments.
FIG.2.
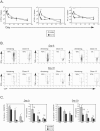
Persistent viral infection induces rapid CD4 T-cell inactivation. (A) Splenocytes from the same experiment shown in Fig. 1B were isolated at the indicated days post-Armstrong (ARM) or post-Clone 13 (Cl 13) infection. The absolute numbers of IFN-γ-producing (left panel), TNF-α-producing (middle panel), and IL-2-producing (right panel) SMARTA cells were assessed by intracellular cytokine staining. Each point represents the average ± standard deviation (SD) for three mice and is representative of at least two experiments. Asterisks denote statistical difference between Armstrong and Clone 13 infection at the indicated time point (P ≤ 0.05). (B) Representative dot plots at 9 (top panels) and 33 (bottom panels) days post-Armstrong or post-Clone 13 infection are shown for the time course illustrated in panel A. These time points were selected to provide an example of the acute (day 9) and chronic (day 33) phase of a persistent viral infection. The production of IFN-γ, TNF-α, and IL-2 was analyzed by intracellular flow cytometry after stimulation with GP61-80 peptide in vitro. Data are from a single Armstrong- or Clone 13-infected mouse. Flow plots are gated on SMARTA cells, and the number indicates the frequency of SMARTA cells that produced each cytokine. (C) The percentage of SMARTA cells producing IFN-γ, TNF-α, and IL-2 in the spleen during the acute phase (day 9) (left panels) and memory or chronic phase (day 33) (right panels) of Armstrong (ARM) or Clone 13 (Cl 13) is shown. The MFI of each cytokine is shown in the right graph of each set. Asterisks denote statistical significance (P ≤ 0.05), and the numbers represent the fold difference in MFI between SMARTA cells from Armstrong and Clone 13 infections. Each point represents the average ± SD for three mice and is representative of at least two experiments.
FIG.3.
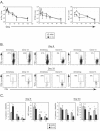
T-cell inactivation in a nonlymphoid tissue. (A) Infiltrating liver lymphocytes from the same experiment shown in Fig. 2 were isolated at the indicated days post-Armstrong (ARM) or post-Clone 13 (Cl 13) infection. The absolute number of IFN-γ- (left panel), TNF-α- (middle panel), and IL-2-producing (right panel) SMARTA cells was assessed by intracellular cytokine staining. Each point represents the average ± standard deviation for three mice and is representative of at least two experiments. Asterisks denote statistical significance at the indicated time point (P ≤ 0.05). (B) Representative dot plots at days 9 (top panels) and 33 (bottom panels) post-Armstrong or post-Clone 13 infection are shown for the time course illustrated in panel A. The production of IFN-γ, TNF-α, and IL-2 was analyzed by intracellular flow cytometry. Data are from a single Armstrong- or Clone 13-infected mouse. Flow plots are gated on liver-infiltrating SMARTA cells, and the number in each plot indicates the frequency of SMARTA cells that produced each cytokine. (C) The percentage and MFI of IFN-γ, TNF-α, and IL-2 by liver-infiltrating SMARTA cells were analyzed as described in the legend for Fig. 2C.
FIG. 4.
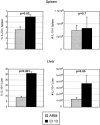
Increased IL-10 production during persistent infection. Spleen (top panels) and liver (bottom panels) cells from Armstrong-infected (ARM) or Clone 13-infected (Cl 13) animals were isolated 5 days postinfection. The percentage (left panels) and absolute number (right panels) of IL-10-producing SMARTA cells were analyzed by intracellular flow cytometry. Bar graphs represent the average ± standard deviation from three mice in each group and are representative of three experiments. The corresponding P values for statistically different groups are denoted on the graphs.
FIG. 5.
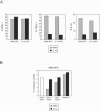
Chronic infection prevents the establishment of memory CD4 T-cell responses. A. Mice that had been previously infected with Armstrong (gray bars) or Clone 13 (black bars) were either left alone (left bars in each panel) or were rechallenged (right bars in each panel) with Clone 13. After 3 days, the livers of individual mice were isolated, and the number of SMARTA cells (left panel) was determined. IFN-γ (middle panel) and TNF-α (right panel) production were assessed by intracellular flow cytometry. Values represent the average ± standard deviation of three to four mice in each group.
FIG. 6.
CD4 T-cell inactivation is not due to active repression or the generation of T regulatory cells. (A) Splenocytes from Armstrong-infected (ARM) or Clone 13-infected (Cl 13) animals were isolated 9 days postinfection and pooled separately. CD4 T cells from each population were then sorted and incubated with T-cell-depleted APC from Armstrong-infected (left bars in each panel) or Clone 13-infected (right bars in each panel) animals. The cells that served as APC were isolated 9 days postinfection from mice infected in parallel but that did not receive SMARTA cells. GP61-80 peptide was added to each culture, and the production of IFN-γ (left panel), TNF-α (middle panel), and IL-2 (right panel) was quantified by intracellular flow cytometry. Data are from a single experiment and are representative of two to three different experiments each containing pools of three spleens per group. (B) Splenocytes from Armstrong-infected (ARM) or Clone 13-infected (Cl 13) animals were isolated 9 days postinfection and pooled. SMARTA, endogenous CD4+/CD25+, and endogenous CD4+/CD25− populations were sorted by fluorescence-activated cell sorter. CFSE-labeled, naïve SMARTA cells were then mixed with equal numbers of each of these populations. These cell mixtures were then added to T-cell-depleted APC from an animal that had been infected with Armstrong 3 days previously. Naïve SMARTA cell proliferation was assessed after 5 days in culture by flow cytometric analysis of CFSE dilution. Bars represent the frequency of naïve SMARTA cells that proliferated during the culture period. The white bar represents cultures that received CFSE-labeled naïve SMARTA cells and T-cell-depleted APC but none of the sorted CD4 T-cell populations.
FIG. 7.
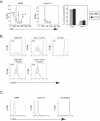
Efficient antigen presentation and enhanced stimulatory activity by APC during persistent infection. (A) Splenic SMARTA cells from Armstrong- or Clone 13-infected mice were isolated 5 days postinfection, and the percentages of SMARTA cells (Thy1.1+) in the G0/G1a, S, and G2/M stages of the cell cycle were determined directly ex vivo by intracellular DAPI labeling of DNA. An example of the cell cycle profile on day 5 following Armstrong (left panel) or Clone 13 (middle panel) infection is shown. The percentage of cycling SMARTA cells from day 5 and day 9 post-Armstrong (ARM) and post-Clone 13 (Cl 13) infection is shown (right panel). Values represent the average ± standard deviation of threemice in each group. (B) CFSE-labeled, naïve SMARTA cells were cultured for 5 days either alone (upper right panel) or with T-cell-depleted APC from an animal that had been infected 3 days earlier with Armstrong (upper left panel) or Clone 13 (upper middle panel). In parallel CFSE-labeled naïve SMARTA cells were cultured with T-cell-depleted APC (Armstrong, bottom left panel; Clone 13, bottom right panel) in the presence of exogenous GP61-80 peptide. Histograms are gated on SMARTA cells, and proliferation was assessed by flow cytometry based on the dilution of CFSE. Numbers in the upper left of each panel represent the total percentage of naïve SMARTA cells that had progressed through one or more divisions. These data show a single experiment and are representative of two to three experiments. (C) CFSE-labeled, naïve SMARTA cells were transferred into C57BL/6 mice that were left uninfected (right panel) or that were subsequently infected with Armstrong (left panel) or Clone 13 (middle panel). Splenocytes were isolated 5 days postinfection, and proliferation was analyzed by CFSE dilution. Flow plots are gated on SMARTA cells. Data are from a single mouse and are representative of three animals per group.
Similar articles
- Differential tissue-specific regulation of antiviral CD8+ T-cell immune responses during chronic viral infection.
Zhou S, Ou R, Huang L, Price GE, Moskophidis D. Zhou S, et al. J Virol. 2004 Apr;78(7):3578-600. doi: 10.1128/jvi.78.7.3578-3600.2004. J Virol. 2004. PMID: 15016881 Free PMC article. - Defining parameters for successful immunocytotherapy of persistent viral infection.
Berger DP, Homann D, Oldstone MB. Berger DP, et al. Virology. 2000 Jan 20;266(2):257-63. doi: 10.1006/viro.1999.0074. Virology. 2000. PMID: 10639312 - Therapeutic depletion of natural killer cells controls persistent infection.
Waggoner SN, Daniels KA, Welsh RM. Waggoner SN, et al. J Virol. 2014 Feb;88(4):1953-60. doi: 10.1128/JVI.03002-13. Epub 2013 Nov 27. J Virol. 2014. PMID: 24284324 Free PMC article. - The role of CD4+ cells in sustaining lymphocyte proliferation during lymphocytic choriomeningitis virus infection.
Kasaian MT, Leite-Morris KA, Biron CA. Kasaian MT, et al. J Immunol. 1991 Mar 15;146(6):1955-63. J Immunol. 1991. PMID: 1672337 - Fighting Viral Infections and Virus-Driven Tumors with Cytotoxic CD4+ T Cells.
Muraro E, Merlo A, Martorelli D, Cangemi M, Dalla Santa S, Dolcetti R, Rosato A. Muraro E, et al. Front Immunol. 2017 Feb 27;8:197. doi: 10.3389/fimmu.2017.00197. eCollection 2017. Front Immunol. 2017. PMID: 28289418 Free PMC article. Review.
Cited by
- Viral coinfections in COVID-19.
Aghbash PS, Eslami N, Shirvaliloo M, Baghi HB. Aghbash PS, et al. J Med Virol. 2021 Sep;93(9):5310-5322. doi: 10.1002/jmv.27102. Epub 2021 Jun 12. J Med Virol. 2021. PMID: 34032294 Free PMC article. Review. - Concentrations of IL-15, IL-18, IFN-γ and activity of CD4+, CD8+ and NK cells at admission in children with viral bronchiolitis.
Grześk E, Kołtan S, Dębski R, Wysocki M, Gruszka M, Kubicka M, Kołtan A, Grześk G, Manysiak S, Odrowąż-Sypniewska G. Grześk E, et al. Exp Ther Med. 2010 Sep;1(5):873-877. doi: 10.3892/etm.2010.119. Epub 2010 Jul 20. Exp Ther Med. 2010. PMID: 22993612 Free PMC article. - Blimp-1-mediated CD4 T cell exhaustion causes CD8 T cell dysfunction during chronic toxoplasmosis.
Hwang S, Cobb DA, Bhadra R, Youngblood B, Khan IA. Hwang S, et al. J Exp Med. 2016 Aug 22;213(9):1799-818. doi: 10.1084/jem.20151995. Epub 2016 Aug 1. J Exp Med. 2016. PMID: 27481131 Free PMC article. - PD-1+Tim-3+ CD8+ T Lymphocytes Display Varied Degrees of Functional Exhaustion in Patients with Regionally Metastatic Differentiated Thyroid Cancer.
Severson JJ, Serracino HS, Mateescu V, Raeburn CD, McIntyre RC Jr, Sams SB, Haugen BR, French JD. Severson JJ, et al. Cancer Immunol Res. 2015 Jun;3(6):620-30. doi: 10.1158/2326-6066.CIR-14-0201. Epub 2015 Feb 19. Cancer Immunol Res. 2015. PMID: 25701326 Free PMC article. - T cells facilitate recovery from Venezuelan equine encephalitis virus-induced encephalomyelitis in the absence of antibody.
Brooke CB, Deming DJ, Whitmore AC, White LJ, Johnston RE. Brooke CB, et al. J Virol. 2010 May;84(9):4556-68. doi: 10.1128/JVI.02545-09. Epub 2010 Feb 24. J Virol. 2010. PMID: 20181704 Free PMC article.
References
- Adler, A. J., C. T. Huang, G. S. Yochum, D. W. Marsh, and D. M. Pardoll. 2000. In vivo CD4+ T cell tolerance induction versus priming is independent of the rate and number of cell divisions. J. Immunol. 164:649-655. - PubMed
- Berger, D. P., D. Homann, and M. B. Oldstone. 2000. Defining parameters for successful immunocytotherapy of persistent viral infection. Virology 266:257-263. - PubMed
Publication types
MeSH terms
Substances
Grants and funding
- DK55037/DK/NIDDK NIH HHS/United States
- DK58541/DK/NIDDK NIH HHS/United States
- AI09484/AI/NIAID NIH HHS/United States
- R01 DK058541/DK/NIDDK NIH HHS/United States
- T32 AI007244/AI/NIAID NIH HHS/United States
- R01 AI009484/AI/NIAID NIH HHS/United States
- R01 DK055037/DK/NIDDK NIH HHS/United States
- R21 NS048866/NS/NINDS NIH HHS/United States
- NS048866-01/NS/NINDS NIH HHS/United States
- AI07244-22/AI/NIAID NIH HHS/United States
LinkOut - more resources
Full Text Sources
Other Literature Sources
Research Materials
