Condensin binding at distinct and specific chromosomal sites in the Saccharomyces cerevisiae genome - PubMed (original) (raw)
Condensin binding at distinct and specific chromosomal sites in the Saccharomyces cerevisiae genome
Bi-Dar Wang et al. Mol Cell Biol. 2005 Aug.
Abstract
Mitotic chromosome condensation is chiefly driven by the condensin complex. The specific recognition (targeting) of chromosomal sites by condensin is an important component of its in vivo activity. We previously identified the rRNA gene cluster in Saccharomyces cerevisiae as an important condensin-binding site, but both genetic and cell biology data suggested that condensin also acts elsewhere. In order to characterize the genomic distribution of condensin-binding sites and to assess the specificity of condensin targeting, we analyzed condensin-bound sites using chromatin immunoprecipitation and hybridization to whole-genome microarrays. The genomic condensin-binding map shows preferential binding sites over the length of every chromosome. This analysis and quantitative PCR validation confirmed condensin-occupied sites across the genome and in the specialized chromatin regions: near centromeres and telomeres and in heterochromatic regions. Condensin sites were also enriched in the zones of converging DNA replication. Comparison of condensin binding in cells arrested in G(1) and mitosis revealed a cell cycle dependence of condensin binding at some sites. In mitotic cells, condensin was depleted at some sites while enriched at rRNA gene cluster, subtelomeric, and pericentromeric regions.
Figures
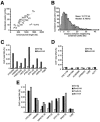
FIG. 1.
Condensin-binding sites are present on all chromosomes. (A) Correlation between chromosome length (x axis) and number of condensin-binding peaks (y axis). Condensin distribution peaks (twofold or greater above the whole-genome median value) were defined as described in Materials and Methods, using microarray analyses of Smc2p-HA ChIP (W303/pAS532 asynchronous culture). The regression line shown was established using the least-squares method. Loci with just one microarray data point available were excluded from this analysis. (B) Condensin-binding sites show a skewed distribution. The plot shows the distribution of distances between the two neighboring condensin-binding sites. Loci with just one microarray data point available are excluded. (C) ChIP-qPCR validation of condensin-enriched sites. Sites tested were either selected from condensin peaks associated with array elements (ORF or IGR) that were no longer than 500 bp or were selected from peaks that Peakfinder identified as residing at an IGR-ORF boundary (5′ or 3′). PCR primers were chosen that either included the whole locus or encompassed the IGR-ORF boundary (∼500 bp long with a center at the boundary), respectively. (5) and (3), 5′ and 3′ IGRs, respectively. TUB2 was used throughout as a negative control. (D) ChIP-qPCR validation of cold spots for condensin binding. Loci that Peakfinder identified as lacking condensin binding were validated by qPCR using criteria similar to those used for panel C. (E) Condensin subunits colocalize at the binding peaks. ChIP-qPCR analysis of sampled Smc2p-binding hot spots (identified from microarray analysis) in strains YPH499bp2 (Smc2-HA), YPH499bp5 (Ycs5-HA), and YPH499bp6 (Brn1-HA), all asynchronous cultures in an S288C background.
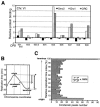
FIG. 2.
Condensin-binding loci lack a base composition bias. (A and B) For chromosomes XII (A) and III (B), the condensin-binding profile produced by Peakfinder (see Materials and Methods) is shown in green (left y axis). A smoothed G+C content profile (5-kb sliding window) is shown in red (right y axis), aligned so that the x axis intercepts at the median G+C content value. Fifty-kilobase intervals are marked with gray lines. Asterisks mark condensin peaks located within 10 kb of centromeres, next to the rRNA gene cluster, and at the HM loci. (C) Comparison of the A+T content of condensin-enriched sites with the A+T content of the genome. A+T contents for each array element (ORF or IGR) were calculated and binned into 1% intervals (blue line, left y axis). A+T contents for each condensin-enriched site were also plotted in 1% intervals (green line, right y axis).
FIG. 3.
Cohabitation of condensin with specialized chromatin. (A) Comparison of condensin peak densities in pericentric regions. The number of condensin sites was averaged for all chromosomes for regions defined as pericentromeric (CEN, 10-kb region centered at each CDEIII), _CEN_-L (10 kb to the left of the pericentromeric 10-kb region) and _CEN_-R (10 kb to the right of the pericentromeric 10-kb region) regions and compared to the average density of condensin peaks in the entire genome. Data were generated from the ChIP-chip experiment with W303/pAS532. (B) Smc2p-HA ChIP-qPCR scanning of the CEN4 region in an asynchronous cultures of W303/pAS532. Tiling PCR probes encompass 4 kb around CEN4 with 500-bp intervals. The TUB2 ChIP/input ratio in the same experiment was less than 0.01%. (C) Condensin sites are present in subtelomeric heterochromatin. Smc2p-HA chromatin enrichment was analyzed in W303/pAS532. PCR probes used for ChIP-qPCR measurements of condensin binding at the VI-R telomere region were the same as in reference . The agarose gel bands are the end products of ChIP-qPCR (ChIP and input [IN]), while numerical values correspond to linear-range qPCR data (tag + ChIP, %). Condensin is associated with the site located 0.6 kb from the telomeric repeats but not with other subtelomeric sites (0.35 or 1.4 kb from TEL). ChIP material from a W303 strain lacking the HA tag and PCRs using TUB2 primers were used as negative controls. (D) Condensin association at HML and HMR. PCR probes were as in reference . The gel shows the end products of ChIP-qPCR (ChIP and input [IN]). The linear-range qPCR data (tag + ChIP, %) show Smc2p-HA association with _HML_α and HMRa in W303/pAS532. Negative controls were as in panel C.
FIG. 4.
Condensin-binding sites correlate with replication landmarks. (A) Negative correlation between Smc2p and ORC complex binding at chromosome (Chr.) VI replication origins. The resolution of this analysis is determined by the sizes of microarray elements (mean lengths: ORF, 1,404 nucleotides; IGR, 472 nucleotides). Correlation analysis after variance normalization was according to reference . (B) Calculation of the relative replication index. For each condensin-enriched locus, a relative replication time coordinate (index) was calculated as follows: the relative replication time for each condensin peak (t x − t 0) was divided by the time separating the nearest origin from the corresponding replication terminus (t n − t 0). Replication time values are from reference . Only loci that displayed condensin enrichment in three independent ChIP-chip experiments were included in this analysis. (C) Whole-genome distribution of condensin peaks relative to replication landmarks. The relative replication index for all euchromatic condensin peaks in the genome was calculated as illustrated for panel B, and the distribution of relative replication index values (2.5% bins, where each origin is 0% and each termination zone is 100%) was determined. Condensin depletion at the origin loci and enrichment at the termination zones are apparent. The mean number of condensin peaks per bin was 18.9 ± 14.3.
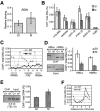
FIG. 5.
Condensin targeting at different cell cycle phases. (A) Mitotic enrichment of condensin at RDN1 hot spots in mitosis. Data generated from Smc2p-HA ChIPs in W303/pAS532 (α-factor and nocodazole arrest). Variance bars generated as a result of averaging for four hot spots (54). (B) Comparison of condensin binding to selected sites in G1 and M phases. Data were generated from Smc2p-HA ChIP (W303/pAS532) either after α-factor arrest or under nocodazole arrest, followed by qPCR. (5) and (3), 5′ and 3′ IGRs, respectively. TUB2 is a negative control. (C) Condensin binds the PTR2 IGR with higher affinity in G1. Experimental conditions were as in panel B. x coordinates correspond to the centers of 300-bp PCR probes (500 bp apart). (D) Condensin binds _HML_α and HMRa with higher affinity in G1. Experimental conditions were as in panel B. The end products of ChIP-qPCR (gel) and linear-range qPCR data (bar graph) are shown. (E) Condensin is enriched at a subtelomeric site in mitosis. TEL VI, telomeric region VIR. The experiment and data analysis are as in panel D. Error bars in panels B, D, and E represent standard deviations. (F) A pericentric site has higher condensin occupancy in mitosis. Experimental conditions were as in panel B. Relative PCR probe positions around CEN4 are as in panel C.
Similar articles
- Cti1/C1D interacts with condensin SMC hinge and supports the DNA repair function of condensin.
Chen ES, Sutani T, Yanagida M. Chen ES, et al. Proc Natl Acad Sci U S A. 2004 May 25;101(21):8078-83. doi: 10.1073/pnas.0307976101. Epub 2004 May 17. Proc Natl Acad Sci U S A. 2004. PMID: 15148393 Free PMC article. - Cell cycle-dependent kinetochore localization of condensin complex in Saccharomyces cerevisiae.
Bachellier-Bassi S, Gadal O, Bourout G, Nehrbass U. Bachellier-Bassi S, et al. J Struct Biol. 2008 May;162(2):248-59. doi: 10.1016/j.jsb.2008.01.002. Epub 2008 Jan 11. J Struct Biol. 2008. PMID: 18296067 - [Functions of Smc5/6 complex revealed by ChIP-on-chip analysis].
Sutani T, Shirahige K. Sutani T, et al. Tanpakushitsu Kakusan Koso. 2007 Jan;52(1):25-30. Tanpakushitsu Kakusan Koso. 2007. PMID: 17228837 Review. Japanese. No abstract available. - The ABCs of SMC proteins: two-armed ATPases for chromosome condensation, cohesion, and repair.
Hirano T. Hirano T. Genes Dev. 2002 Feb 15;16(4):399-414. doi: 10.1101/gad.955102. Genes Dev. 2002. PMID: 11850403 Review. No abstract available.
Cited by
- Ccq1p and the condensin proteins Cut3p and Cut14p prevent telomere entanglements in the fission yeast Schizosaccharomyces pombe.
Motwani T, Doris R, Holmes SG, Flory MR. Motwani T, et al. Eukaryot Cell. 2010 Oct;9(10):1612-21. doi: 10.1128/EC.00339-09. Epub 2010 Aug 13. Eukaryot Cell. 2010. PMID: 20709788 Free PMC article. - Condensin goes with the family but not with the flow.
Gartenberg MR, Merkenschlager M. Gartenberg MR, et al. Genome Biol. 2008 Oct 6;9(10):236. doi: 10.1186/gb-2008-9-10-236. Genome Biol. 2008. PMID: 18844972 Free PMC article. Review. - Condensin minimizes topoisomerase II-mediated entanglements of DNA in vivo.
Dyson S, Segura J, Martínez-García B, Valdés A, Roca J. Dyson S, et al. EMBO J. 2021 Jan 4;40(1):e105393. doi: 10.15252/embj.2020105393. Epub 2020 Nov 6. EMBO J. 2021. PMID: 33155682 Free PMC article. - A Cohesin-Based Partitioning Mechanism Revealed upon Transcriptional Inactivation of Centromere.
Tsabar M, Haase J, Harrison B, Snider CE, Eldridge B, Kaminsky L, Hine RM, Haber JE, Bloom K. Tsabar M, et al. PLoS Genet. 2016 Apr 29;12(4):e1006021. doi: 10.1371/journal.pgen.1006021. eCollection 2016 Apr. PLoS Genet. 2016. PMID: 27128635 Free PMC article. - Dissection of the essential steps for condensin accumulation at kinetochores and rDNAs during fission yeast mitosis.
Nakazawa N, Nakamura T, Kokubu A, Ebe M, Nagao K, Yanagida M. Nakazawa N, et al. J Cell Biol. 2008 Mar 24;180(6):1115-31. doi: 10.1083/jcb.200708170. J Cell Biol. 2008. PMID: 18362178 Free PMC article.
References
- Bazett-Jones, D. P., K. Kimura, and T. Hirano. 2002. Efficient supercoiling of DNA by a single condensin complex as revealed by electron spectroscopic imaging. Mol. Cell 9:1183-1190. - PubMed
- Bhat, M. A., A. V. Philp, D. M. Glover, and H. J. Bellen. 1996. Chromatid segregation at anaphase requires the barren product, a novel chromosome-associated protein that interacts with topoisomerase II. Cell 87:1103-1114. - PubMed
- Bloom, K. S., and J. Carbon. 1982. Yeast centromere DNA is in a unique and highly ordered structure in chromosomes and small circular minichromosomes. Cell 29:305-317. - PubMed
- Brown, A., and M. Tuite (ed.). 1998. Yeast gene analysis, vol. 26. Academic Press, San Diego, Calif.
MeSH terms
Substances
LinkOut - more resources
Full Text Sources
Molecular Biology Databases


