Maternal embryonic leucine zipper kinase (MELK) regulates multipotent neural progenitor proliferation - PubMed (original) (raw)
. 2005 Aug 1;170(3):413-27.
doi: 10.1083/jcb.200412115.
Andres A Paucar, Ruchi Bajpai, Joseph D Dougherty, Amani Zewail, Theresa K Kelly, Kevin J Kim, Jing Ou, Matthias Groszer, Tetsuya Imura, William A Freije, Stanley F Nelson, Michael V Sofroniew, Hong Wu, Xin Liu, Alexey V Terskikh, Daniel H Geschwind, Harley I Kornblum
Affiliations
- PMID: 16061694
- PMCID: PMC2171475
- DOI: 10.1083/jcb.200412115
Maternal embryonic leucine zipper kinase (MELK) regulates multipotent neural progenitor proliferation
Ichiro Nakano et al. J Cell Biol. 2005.
Abstract
Maternal embryonic leucine zipper kinase (MELK) was previously identified in a screen for genes enriched in neural progenitors. Here, we demonstrate expression of MELK by progenitors in developing and adult brain and that MELK serves as a marker for self-renewing multipotent neural progenitors (MNPs) in cultures derived from the developing forebrain and in transgenic mice. Overexpression of MELK enhances (whereas knockdown diminishes) the ability to generate neurospheres from MNPs, indicating a function in self-renewal. MELK down-regulation disrupts the production of neurogenic MNP from glial fibrillary acidic protein (GFAP)-positive progenitors in vitro. MELK expression in MNP is cell cycle regulated and inhibition of MELK expression down-regulates the expression of B-myb, which is shown to also mediate MNP proliferation. These findings indicate that MELK is necessary for proliferation of embryonic and postnatal MNP and suggest that it regulates the transition from GFAP-expressing progenitors to rapid amplifying progenitors in the postnatal brain.
Figures
Figure 1.
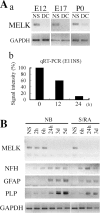
MELK is highly enriched in cultures containing multipotent progenitors. (A, a) MELK expression as determined by semiquantitative RT-PCR using GAPDH as a standard in neurospheres (NS) and differentiated sister cultures generated by the withdrawal of bFGF (DC) derived from telencephalon (E12) or cerebral cortex (E17, P0). (b) Quantitative RT-PCR of MELK expression during differentiation of neurospheres derived from E11 telencephalon. (B) RT-PCR analysis of MELK, and lineage-specific markers during E12 neurosphere (NS) differentiation induced by mitogen withdrawal or stimulation of retinoic acid and FBS at the times indicated. Abbreviations: NFH, neurofilament heavy chain; GFAP, glial fibrillary acidic protein; PLP, proteolipid protein.
Figure 2.
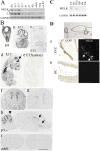
Developmental and regional expression of MELK mRNA in vivo. (A, a) MELK expression in ES cells and during brain development analyzed by RT-PCR. The triangle indicates increasing cycle number. (B) In situ hybridization with radiolabeled antisense MELK cRNA. Arrows in indicate the neuroepithelium. Arrowhead in h points to the cerebellum. (e) Sense probe. (C) RT-PCR analysis of different regions of adult brain. (D) Emulsion-dipped brain section (counterstained by GFAP immunohistochemistry) demonstrating hybridization in scattered cells within the forebrain SVZ (a, arrows), but absence of MELK hybridization in the hippocampus (b). Abbreviations: CX, cerebral cortex; HC, hippocampus; OB, olfactory bulb; BS, brain stem; CB, cerebellum. Bar in B: 13.7 mm in a; 8.9 mm in b; 5.5 mm in d–f; 4.1 mm in g; 7.8 mm in h; and 4.5 mm in i. Bar in D: 750 μm in top; 75 μm in a; 75 μm in b.
Figure 3.
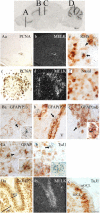
MELK expression in proliferating CNS progenitors in vivo. The photomicrographs in A–D are of dipped sections sampled from the regions identified in the brain section at the top. Sections were hybridized with MELK cRNA, and then stained by immunohistochemistry. (A) Coronal section through the rostral forebrain at P7. MELK mRNA was restricted to the germinal epithelium (a and b). Co-expression in brain GZs with PCNA (a–d, arrows in e). MELK was not detected in extracranial PCNA-positive cells (f). (B) Limited to no coexpression with GFAP on P1 or P7 (a and b, arrows), with greater coexpression in adult SVZ (c, arrow). (C) Co-expression with GFAP in the hippocampus hilar border on P7 (a, arrow). There is no coexpression with TuJ1 in the dentate gyrus (b, arrow). (D) Granule cell layer expression in the P7 cerebellum (a and b). MELK mRNA was present in the outer proliferative region, but not in the inner premigratory TuJ1-positive granule cells (c). Cells indicated by arrows are shown in the insets. GCL, granule cell layer; iGCL, inner layer of GCL; oGCL, outer layer of GCL; V, ventricle. Bar in A: 610 μm in a and b; 61 μm in c and d; 22 μm in e and f. bar in B: 55 μm in a; 45 μm in b; 31 μm in c. Bar in C: 22 μm. Bar in D: 50 μm in a and b; 22 μm in c.
Figure 4.
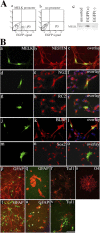
The MELK promoter is active only in undifferentiated neural progenitors. (A) FACS analysis of UD cells transfected with the MELK promoter–containing (a) and control (b) EGFP clones. (c) RT-PCR for MELK after separation of the fluorescence-positive (P3) and -negative (P1) cells in panel a by flow cytometry. (B) Colocalization of EGFP fluorescence driven by the MELK promoter (a–p) or the CMV promoter (t) in undifferentiated progenitors or in differentiated progenitors (q–s, u, and v) with nestin, NG2, RC2, BLBP, Sox2, GFAP, O4, or TuJ1 immunoreactivity. Bar in B: 44 μm in all except for s, where it equals 22 μm.
Figure 5.
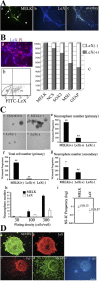
MELK-expressing progenitors are neurosphere-initiating MNPs. (A) PMELK-EGFP expression overlaps with LeX immunofluorescence. Arrows/arrowheads indicate LeX-positive, MELK-negative cells in the same culture. Arrowhead is negative, arrow is positive. (B) MELK expression in LeX-sorted cells. (a) Staining of sorted cells (P3 fraction in b) with anti-LeX antibody. (b) FACS analysis showing LeX-positive (P3) and -negative (P2) fractions. (c) Percentage of total RT-PCR product in Lex-positive (gray bar) vs. LeX-negative (white bar) fraction for each gene listed. 100% is the total amount of GAPDH-normalized signal in LeX-positive and LeX-negative fractions combined. (C) Neurospheres production after LeX sorting or sorting for GFP after transfection of PMELK-EGFP (a–d). (e) Neurosphere numbers obtained from sorted cells expressed as a percentage of cells obtained in unsorted populations. (f) Cell numbers corresponding to the conditions in panel e. (g) Secondary neurosphere numbers after dissociation of the primary spheres counted in panel e as a percentage of the primary neurosphere numbers derived from unsorted progenitors. The graph in panel h demonstrates the numbers of neurospheres resulting from the seeding of 30, 100, or 300 cells, achieved by serial dilution, of MELK-positive cells and LeX-positive cells. (i) Frequency of neurosphere-initiating cells (NS-IC). (D) Secondary neurospheres from MELK-positive progenitors were stained as spheres (top panels) or after differentiation in the absence of mitogen. Undifferentiated spheres intensely labeled with anti-nestin and anti-LeX antibodies (a and b). Differentiated spheres demonstrate TuJ1-positive neurons, GFAP-positive astrocytes, and O4-positive oligodendrocytes (c–e). Asterisk denotes different from controls, P < 0.05; **, P < 0.001, ANOVA followed by post-hoc t test. Bar in C: 200 μm. Bar in D: 110 μm in a and b; 207 μm in c–e.
Figure 6.
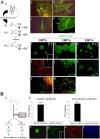
MELK-positive cells are self-renewing multipotent progenitors in vivo. (A, a) Experimental design of long-term passage of neurospheres from transgenic reporter mice. Expression of EGFP in a P8 transgenic mouse demonstrating specific signals in the SVZ (b and c), dentate gyrus (DG) of hippocampus (d), and granule cell layer in cerebellum (e), all indicated by arrows. (f–m) Neurospheres grown from P1 cortices were substantially all EGFP-positive from passage 1 (P1, f) to passage 12 (P12, h). Inset in (f) shows a wild-type neurosphere. Differentiated primary spheres contain TuJ1-positive neurons (i), GFAP-positive astrocytes (j), and O4-positive oligodendrocytes (k). Inset in (i) shows a magnified positive cell. Differentiated cells from P2 and P12 neurospheres are shown by immunocytochemistry (l and m). (B, a) Experimental design of direct FACS from P1 cortex. (b) Graph shows the number of neurospheres from PMELK-EGFP(+) and PMELK-EGFP(−) cells both in clonal and nonclonal conditions. **, P < 0.001, ANOVA followed by post-hoc t test. Undifferentiated clonal neurospheres (c) were differentiated and stained with TuJ1 (d), GFAP (e), and O4 (f). Inset in (d) shows a magnified positive cell. Bar in A: 375 μm in b and c; 188 μm in d and e; 44 μm in f–j and l; 88 μm in k and m. Bar in B:110 μm in c; 44 μm in d–f.
Figure 7.
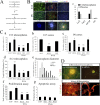
MELK regulates neural progenitor proliferation. (A) Experimental design. (B) Characterization of adherent progenitors from neurospheres generated from E12 telencephalon and P0 cerebral cortices (a–f). Monolayer progenitor cultures from neurospheres were immunostained for nestin, LeX, GFAP, TuJ1, and O4 antibodies. Propidium iodide (PI) was used for nuclear staining. (g) Relative percentages of adherent cells expressing markers. (h) LeX staining of undifferentiated secondary spheres. (i and j) LeX, TuJ1, O4, and PI staining of differentiating secondary spheres (C) Sphere counts (a–c), total cell counts (d), sphere diameters (e), percent BrdU incorporation (f), and percent apoptotic cells (g) after overexpression or knockdown of MELK in adherent progenitors cultured at the ages shown. Controls cultures were transfected with EGFP-expressing cDNA or nucleostemin (NCS) or calreticulin (CRT1) siRNAs. All graphs are the means ± SD. (D) TuJ1 immunoreactivity of differentiating secondary neurospheres, which were derived from primary neurospheres after transfection (a and b) and of adherent progenitors from primary E12 neurospheres that were directly differentiated (c and d) after transfection. Asterisk denotes different from controls, P < 0.05; **, P < 0.001, ANOVA followed by post-hoc t test. Bar in B: 110 μm in a–f; 215 μm in h–j. Bar in D: 235 μm in all panels.
Figure 8.
MELK is necessary for the transition from GFAP-positive into GFAP-negative highly proliferative progenitors in vitro. (A) RT-PCR of cortical astrocyte cultures after addition of bFGF on d 1 and 7. (B and C) Effects of MELK siRNA on the formation of multipotent progenitors from astrocyte cultures. (B) Immunostaining for GFAP and LeX after bFGF addition. (C, a) Sphere-forming frequency of LeX-positive and -negative cells derived from GFAP-positive astrocyte cultures (mean ± SD). Change in total cell number (b), LeX-positive cell number (c), GFAP-positive cell number (d), neurosphere numbers (e), and apoptosis (f) after MELK siRNA or control treatment in bFGF-treated astrocyte cultures. Counts were based on two independent experiments for each condition (ctrl, control; crt1, calreticulin1 siRNA; NCS = nucleostemin siRNA). (D) RT-PCR analysis of cultures, after MELK siRNA or control treatment.
Figure 9.
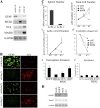
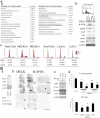
Cell cycle regulation and the B-myb proto-oncogene in MELK function. (A, a) Functional grouping of genes most and least correlated with MELK expression; P < 0.001. (b) RT-PCR after separation of P0 progenitors into apoptotic (A), G0/G1 phases (R), and S/G2/M phases (D). Top panel shows FACS of P0 neurospheres using PI-stained cells. (c) Cell cycle analysis after separation based on either MELK (using PMELK-EGFP) or LeX expression. (B, a) Top: RT-PCR of P0 neurospheres (NS) and differentiated neurospheres (DC). Bottom: RT-PCR after LeX sorting of progenitors derived from E12 telencephalon. (b) B-myb and MELK in situ hybridization. Arrow in adult section indicates expression in the adult hippocampus. (c) RT-PCR after either overexpression or siRNA knockdown of MELK using telencephalic progenitors derived from E11 animals. Triangle indicates increase in PCR cycle number. (d) Effect of B-myb knockdown on neurosphere generation. For E11 progenitors, siRNA concentrations were 25 and 100 nM (triangles). For the P0 progenitors, 100 nM was used. Graph shows the ratio of neurosphere formation for each condition compared with the control condition (mock-transfected on the left, calreticulin siRNA on the right). Asterisk = different from controls, P < 0.05; **, P < 0.001, ANOVA followed by post-hoc t test. Abbreviations: ncs, nucleostemin; msi1, musashi1. Bar in B: 4.5 mm.
Similar articles
- Methods for analysis of brain tumor stem cell and neural stem cell self-renewal.
Nakano I, Kornblum HI. Nakano I, et al. Methods Mol Biol. 2009;568:37-56. doi: 10.1007/978-1-59745-280-9_4. Methods Mol Biol. 2009. PMID: 19582420 - Maternal embryonic leucine zipper kinase is a key regulator of the proliferation of malignant brain tumors, including brain tumor stem cells.
Nakano I, Masterman-Smith M, Saigusa K, Paucar AA, Horvath S, Shoemaker L, Watanabe M, Negro A, Bajpai R, Howes A, Lelievre V, Waschek JA, Lazareff JA, Freije WA, Liau LM, Gilbertson RJ, Cloughesy TF, Geschwind DH, Nelson SF, Mischel PS, Terskikh AV, Kornblum HI. Nakano I, et al. J Neurosci Res. 2008 Jan;86(1):48-60. doi: 10.1002/jnr.21471. J Neurosci Res. 2008. PMID: 17722061 - Maternal embryonic leucine zipper kinase (MELK): a novel regulator in cell cycle control, embryonic development, and cancer.
Jiang P, Zhang D. Jiang P, et al. Int J Mol Sci. 2013 Oct 31;14(11):21551-60. doi: 10.3390/ijms141121551. Int J Mol Sci. 2013. PMID: 24185907 Free PMC article. Review. - Maternal embryonic leucine zipper kinase: key kinase for stem cell phenotype in glioma and other cancers.
Ganguly R, Hong CS, Smith LG, Kornblum HI, Nakano I. Ganguly R, et al. Mol Cancer Ther. 2014 Jun;13(6):1393-8. doi: 10.1158/1535-7163.MCT-13-0764. Epub 2014 May 2. Mol Cancer Ther. 2014. PMID: 24795222 Free PMC article. Review.
Cited by
- MELK-dependent FOXM1 phosphorylation is essential for proliferation of glioma stem cells.
Joshi K, Banasavadi-Siddegowda Y, Mo X, Kim SH, Mao P, Kig C, Nardini D, Sobol RW, Chow LM, Kornblum HI, Waclaw R, Beullens M, Nakano I. Joshi K, et al. Stem Cells. 2013 Jun;31(6):1051-63. doi: 10.1002/stem.1358. Stem Cells. 2013. PMID: 23404835 Free PMC article. - Maternal embryonic leucine zipper kinase serves as a poor prognosis marker and therapeutic target in gastric cancer.
Li S, Li Z, Guo T, Xing XF, Cheng X, Du H, Wen XZ, Ji JF. Li S, et al. Oncotarget. 2016 Feb 2;7(5):6266-80. doi: 10.18632/oncotarget.6673. Oncotarget. 2016. PMID: 26701722 Free PMC article. - Genome-wide effects of MELK-inhibitor in triple-negative breast cancer cells indicate context-dependent response with p53 as a key determinant.
Simon M, Mesmar F, Helguero L, Williams C. Simon M, et al. PLoS One. 2017 Feb 24;12(2):e0172832. doi: 10.1371/journal.pone.0172832. eCollection 2017. PLoS One. 2017. PMID: 28235006 Free PMC article. - Genome-wide transcriptome analysis of Echinococcus multilocularis larvae and germinative cell cultures reveals genes involved in parasite stem cell function.
Herz M, Zarowiecki M, Wessels L, Pätzel K, Herrmann R, Braun C, Holroyd N, Huckvale T, Bergmann M, Spiliotis M, Koziol U, Berriman M, Brehm K. Herz M, et al. Front Cell Infect Microbiol. 2024 Jan 25;14:1335946. doi: 10.3389/fcimb.2024.1335946. eCollection 2024. Front Cell Infect Microbiol. 2024. PMID: 38333034 Free PMC article. - The structures of the kinase domain and UBA domain of MPK38 suggest the activation mechanism for kinase activity.
Cho YS, Yoo J, Park S, Cho HS. Cho YS, et al. Acta Crystallogr D Biol Crystallogr. 2014 Feb;70(Pt 2):514-21. doi: 10.1107/S1399004713027806. Epub 2014 Jan 31. Acta Crystallogr D Biol Crystallogr. 2014. PMID: 24531485 Free PMC article.
References
- Alvarez-Buylla, A., B. Seri, and F. Doetsch. 2002. Identification of neural stem cells in the adult vertebrate brain. Brain Res. Bull. 57:751–758. - PubMed
- Cai, J., Y. Wu, T. Mirua, J.L. Pierce, M.T. Lucero, K.H. Albertine, G.J. Spangrude, and M.S. Rao. 2002. Properties of a fetal multipotent neural stem cell (NEP cell). Dev. Biol. 251:221–240. - PubMed
- Capela, A., and S. Temple. 2002. LeX/ssea-1 is expressed by adult mouse CNS stem cells, identifying them as nonependymal. Neuron. 35:865–875. - PubMed
- Chenn, A., and C.A. Walsh. 2002. Regulation of cerebral cortical size by control of cell cycle exit in neural precursors. Science. 297:365–369. - PubMed
- Davezac, N., V. Baldin, J. Blot, B. Ducommun, and J.P. Tassan. 2002. Human pEg3 kinase associates with and phosphorylates CDC25B phosphatase: a potential role for pEg3 in cell cycle regulation. Oncogene. 21:7630–7641. - PubMed
Publication types
MeSH terms
Substances
Grants and funding
- R21 NS047351/NS/NINDS NIH HHS/United States
- MH60233/MH/NIMH NIH HHS/United States
- R01 NS047386/NS/NINDS NIH HHS/United States
- NS042693/NS/NINDS NIH HHS/United States
- NS38439/NS/NINDS NIH HHS/United States
- R37 MH060233/MH/NIMH NIH HHS/United States
- R01 MH065756/MH/NIMH NIH HHS/United States
- R01 CA107166/CA/NCI NIH HHS/United States
- R01 MH060233/MH/NIMH NIH HHS/United States
- CA107166/CA/NCI NIH HHS/United States
- R56 MH060233/MH/NIMH NIH HHS/United States
- U01 CA084128/CA/NCI NIH HHS/United States
- MH65756/MH/NIMH NIH HHS/United States
- NS47386/NS/NINDS NIH HHS/United States
- CA84128-06/CA/NCI NIH HHS/United States
- NS047351/NS/NINDS NIH HHS/United States
- R21 NS042693/NS/NINDS NIH HHS/United States
LinkOut - more resources
Full Text Sources
Other Literature Sources
Molecular Biology Databases
Miscellaneous
