The caudal migratory stream: a novel migratory stream of interneurons derived from the caudal ganglionic eminence in the developing mouse forebrain - PubMed (original) (raw)
The caudal migratory stream: a novel migratory stream of interneurons derived from the caudal ganglionic eminence in the developing mouse forebrain
Masato Yozu et al. J Neurosci. 2005.
Abstract
The migratory paths of interneurons derived from the ganglionic eminence (GE), and particularly its caudal portion (CGE), remain essentially unknown. To clarify the three-dimensional migration profile of interneurons derived from each part of the GE, we developed a technique involving focal electroporation into a small, defined portion of the telencephalic hemisphere. While the medial GE cells migrated laterally and spread widely throughout the cortex, the majority of the CGE cells migrated caudally toward the caudal-most end of the telencephalon. Time-lapse imaging and an in vivo immunohistochemical study confirmed the existence of a migratory stream depicted by a population of CGE cells directed caudally that eventually reached the hippocampus. Transplantation experiments suggested that the caudal direction of migration of the CGE cells was intrinsically determined as early as embryonic day 13.5. The caudal migratory stream is a novel migratory path for a population of CGE-derived interneurons passing from the subpallium to the hippocampus.
Figures
Figure 1.
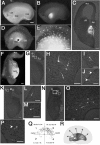
MGE cells migrate laterally and spread widely throughout the cerebral cortex. A-C, Focal electroporation of an FITC-labeled oligonucleotide into E13.5 MGE. Bright-field (A) and fluorescent (B) images of the whole-mount hemisphere and its coronal section (C) indicate that the MGE was indeed specifically labeled. D-P, MGE was electroporated with DsRedEx/CAG at E13.5 and cultured for 40 h. D, E, Medial view of the hemisphere. MGE cells migrated laterally and spread widely throughout the cortex. E, Higher magnification of D. The asterisks in D and F show the point of transfection. F, Thick coronal section (300 μm thick) of the hemisphere. MGE cells migrated tangentially from the MGE to the cortex. G-P, Thin coronal sections (14 μm thick) of the hemisphere. H-J, L, M, O, P, Higher magnification of the boxed areas in G, K, and N, respectively. Some MGE cells showed tangentially migrating morphology from the lateral cortex to the medialcortex (G-I, K-O). MGE cells also migrated in the superficial layer (J, arrowheads). Some cells showed ventricle-directed migration in the cortex (P, arrowhead). Q, Distribution of the MGE-derived fluorescent cells in the GE. Each dot represents one cell. The percentage of MGE cells in each sector was counted [average ± SD (%)]. The black dot in the center represents the site of electroporation. Note that only 7.9 ± 2.6% (SD) of the MGE cells migrated into sector 4. R, Schema of the migratory route of MGE cells. Hip, Hippocampus; Ncx, neocortex. Scale bars: A, B, D, 400 μm; C, F, G, K, N, 200 μm; E, 220 μm; H-J, L, M, O, P, 50 μm.
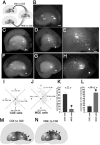
Figure 2.
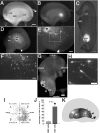
A population of CGE-derived cells migrate caudally toward the caudal-most end of the telencephalon. A-C, An FITC-labeled oligonucleotide was electroporated into the CGE of E13.5 telencephalic hemispheres. Bright-field (A) and fluorescent (B) images of the whole-mount hemisphere and its horizontal section (C) are shown. D-H, Medial view (D-F) and horizontal section (G, H) of a hemisphere cultured for 40 h after the local electroporation of DsRedEx/CAG into the CGE on E13.5. The majority of CGE cells migrated caudally toward the caudal-most end of the telencephalon. The asterisks show the point of transfection. The arrow indicates the caudal end of the CGE. E, Higher magnification of D. F, H, Higher magnification of the boxed areas in E and G, respectively. I, Distribution of the CGE-derived fluorescent cells in the GE in the medial view. Labeled cells were counted at different focal planes. Note that 55.2 ± 5.6% (SD) of the CGE-derived fluorescent cells migrated into sector 4. J, Quantification of the percentages of MGE-derived (Fig. 1_Q_) or CGE-derived (I) cells in sector 4. In sector 4, the percentage of CGE-derived cells was significantly larger than that of the MGE-derived cells (*p < 0.01; data from 3 independent experiments). K, Schema of the migratory routes of the CGE cells. Scale bars: A, B, D, 400 μm; C, E, G, 200 μm; F, 60 μm; H, 30 μm.
Figure 3.
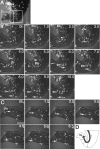
Time-lapse imaging of the caudally migrating cells derived from the CGE. A-C, Horizontal slices were prepared at 40 h in vitro after local electroporation into the CGE of E13.5 telencephalic hemispheres. The asterisk in A shows the place of electroporation. B, C, Time-lapse images of caudally migrating cells from the boxed area in A. A significant number of the CGE-derived cells contributed to the depiction of a clear migratory stream toward the hippocampus. The solid arrowhead (0-7.0 h in B) and the open arrowhead (0-10.0 h in B) point to two caudally migrating cells in the migratory stream. The solid arrows point to a caudally migrating cell that changed direction and moved toward the MZ (6.0-10.0 h in B, 0-6.5 h in C). The open arrow points to a CGE-derived cell moving in the opposite direction to the stream (4.0-6.0 h in B). D, Schema of the migratory paths of the CGE-derived cells in the horizontal slice. Scale bars: A-C, 200 μm. Hip, Hippocampus.
Figure 4.
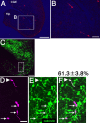
A population of the caudally migrating cells are calbindin immunoreactive. DsRedEx/CAG was electroporated into the CGE of E13.5 telencephalic hemispheres, and horizontal sections were made after 40 h of culture. A, B, CGE-derived cells (red) moved toward the hippocampus in the caudal-most end of the telencephalon. B, Higher magnification of the boxed area in A. C-F, Horizontal sections were immunostained with anti-calbindin (C, E, F; green). CGE-derived cells (C, D, F; purple) were classified as strongly positive (D-F, arrowhead), weakly positive (D-F, arrow), or negative populations for calbindin. Overall, 61.3 ± 3.8% (SD) of the CGE-derived cells were calbindin positive. D-F, Higher magnification of the boxed area in C. Scale bars: A, 200 μm; B, 50 μm; C, 100 μm; D-F, 25 μm. Hip, Hippocampus.
Figure 5.
Existence of the CMS in vivo. A-D, Horizontal sections of E15.5 mouse embryonic brains were immunostained with anti-calbindin (green), and their nuclei were counterstained with PI (A, purple). B-D, Higher magnification of the calbindin staining in the boxed areas in A. B, A significant number of calbindin-positive cells contributed to a clear migratory stream from the CGE to the hippocampus. C, Calbindin-positive cells moving caudally in the CGE (arrows). Some calbindin-positive cells migrated rostrally in the stream (arrowhead). D, Calbindin-positive cells moving toward the hippocampus (arrows). E-L, Birth-dating analysis of the caudally migrating cells. Horizontal sections of brains, taken from E15.5 mice that had received a single pulse of BrdU on E12.5 (E-H) or E13.5 (I-L), were double immunostained with anti-calbindin (E, F, H-J; green) and anti-BrdU (E, G-I, K, L; purple). When BrdU was injected at E12.5, 35.7 ± 1.8% (SD) of the calbindin-positive caudally migrating cells were BrdU positive (F-H, arrow), whereas 25.0 ± 3.2% (SD) were BrdU positive (J-L, arrow) in animals injected with BrdU on E13.5. F-H, Higher magnification of the boxed area in E. J-L, Higher magnification of the boxed area in I. Scale bars: A, 200 μm; B, E, I, 100 μm; C, D, F-H, J-L, 50 μm. Hip, Hippocampus.
Figure 6.
Homotopic transplantation of MGE cells to the MGE and heterotopic transplantation of CGE cells to the MGE. A, Schema of homotopic and heterotopic transplantations to the MGE in telencephalic hemisphere cultures. B, Transplantation to the MGE. Small fragments dissected from the locally electroporated MGE and labeled with FITC oligonucleotides were transplanted into the MGE of another E13.5 hemisphere. C-J, Small fragments of the MGE (C-F) or CGE (G-J) taken from the locally electroporated E13.5 hemispheres and labeled with DsRedEx/CAG were transplanted into the MGE of other E13.5 hemispheres, and the hemispheres were cultured for 40 h. C-F, When electroporated MGE cells were transplanted into the MGE, a number of transplanted cells migrated out of the MGE and moved laterally toward the cerebral cortex. G-J, When electroporated CGE cells were transplanted into the MGE, however, only a small number of transplanted cells migrated out of the MGE. C, D, G, H, Medial view of the cultured telencephalic hemisphere. D, H, Higher magnifications of C and G, respectively. E, F, I, J, Dorsal view of the cultured telencephalic hemisphere. F, J, Higher magnifications of E and I, respectively. K, Quantification of the number of transplanted MGE and CGE cells that migrated out the MGE. A significantly small number of transplanted CGE cells migrated out of the MGE (*p < 0.0008; data from 4 independent experiments). L, Schema of the homotopic transplantation of MGE cells to the MGE. M, Schema of the heterotopic transplantation of CGE cells to the MGE. Scale bars: B, C, G, E, I, 400 μm; D, H, 230 μm; F, J, 170 μm.
Figure 7.
Homotopic transplantation of CGE cells to the CGE and heterotopic transplantation of MGE cells to the CGE. A, Schema of the homotopic and heterotopic transplantations to the CGE in telencephalic hemisphere cultures. B, Transplantation to the CGE. Small fragments dissected from the locally electroporated CGE and labeled with FITC oligonucleotides were transplanted into the CGE of other E13.5 hemispheres. C-H, Small fragments of the CGE (C-E) or MGE (F-H) taken from the locally electroporated E13.5 hemisphere and labeled with DsRedEx/CAG were transplanted into the CGE of other E13.5 hemispheres, and the hemispheres were cultured for 40 h. C-E, When the electroporated CGE cells were transplanted into the CGE, most of the transplanted cells migrated caudally. F-H, When the electroporated MGE cells were transplanted to the CGE, however, the transplanted cells migrated laterally and rostrally. C, F, Medial view of the cultured telencephalic hemisphere. D, E, G, H, Caudally shifted medial view of the hemisphere in C and F, respectively. E, H, Higher magnifications of D and G, respectively. C-H, The asterisks indicate the caudal end of the CGE. I, J, Distribution of the transplanted CGE (I) and MGE (J) cells in the GE after 40 h in vitro. Each dot represents one cell. The number of migrating cells in each of the four sectors [rostral (R), caudal (C), medial (M), and lateral (L)] was counted [average ± SD (%); data from 4 independent experiments]. The black dot in the center represents the site of the transplantation, and the asterisk in sector C represents the caudal end of the CGE. K, L, Quantification of the percentages of transplanted cells in sector C (K) and sector R+L (L). In sector C, the percentage of transplanted MGE cells was significantly smaller than the percentage of transplanted CGE cells (*p < 0.002; data from 4 independent experiments). In sector R+L, the percentage of transplanted MGE cells was significantly larger than the percentage of transplanted CGE cells (*p < 0.002; data from 4 independent experiments). M, Schema of the homotopic transplantation of CGE cells into the CGE. N, Schema of the heterotopic transplantation of MGE cells into the CGE. Scale bars: B-D, F, G, 400 μm; E, H, 200 μm.
Similar articles
- COUP-TFII is preferentially expressed in the caudal ganglionic eminence and is involved in the caudal migratory stream.
Kanatani S, Yozu M, Tabata H, Nakajima K. Kanatani S, et al. J Neurosci. 2008 Dec 10;28(50):13582-91. doi: 10.1523/JNEUROSCI.2132-08.2008. J Neurosci. 2008. PMID: 19074032 Free PMC article. - Molecular control of two novel migratory paths for CGE-derived interneurons in the developing mouse brain.
Touzot A, Ruiz-Reig N, Vitalis T, Studer M. Touzot A, et al. Development. 2016 May 15;143(10):1753-65. doi: 10.1242/dev.131102. Epub 2016 Mar 31. Development. 2016. PMID: 27034423 - Hepatocyte growth factor/scatter factor is a motogen for interneurons migrating from the ventral to dorsal telencephalon.
Powell EM, Mars WM, Levitt P. Powell EM, et al. Neuron. 2001 Apr;30(1):79-89. doi: 10.1016/s0896-6273(01)00264-1. Neuron. 2001. PMID: 11343646 - Intracortical multidirectional migration of cortical interneurons.
Murakami F, Tanaka D, Yanagida M, Yamazaki E. Murakami F, et al. Novartis Found Symp. 2007;288:116-25; discussion 125-9, 276-81. Novartis Found Symp. 2007. PMID: 18494255 Review. - Migratory pathways of GABAergic interneurons when they enter the neocortex.
Tanaka DH, Nakajima K. Tanaka DH, et al. Eur J Neurosci. 2012 Jun;35(11):1655-60. doi: 10.1111/j.1460-9568.2012.08111.x. Epub 2012 May 28. Eur J Neurosci. 2012. PMID: 22639844 Review.
Cited by
- Functional Differentiation of Cholecystokinin-Containing Interneurons Destined for the Cerebral Cortex.
Calvigioni D, Máté Z, Fuzik J, Girach F, Zhang MD, Varro A, Beiersdorf J, Schwindling C, Yanagawa Y, Dockray GJ, McBain CJ, Hökfelt T, Szabó G, Keimpema E, Harkany T. Calvigioni D, et al. Cereb Cortex. 2017 Apr 1;27(4):2453-2468. doi: 10.1093/cercor/bhw094. Cereb Cortex. 2017. PMID: 27102657 Free PMC article. - Interneurons in the developing human neocortex.
Zecevic N, Hu F, Jakovcevski I. Zecevic N, et al. Dev Neurobiol. 2011 Jan 1;71(1):18-33. doi: 10.1002/dneu.20812. Dev Neurobiol. 2011. PMID: 21154907 Free PMC article. - Synapse-specific contributions in the cortical pathology of schizophrenia.
Seshadri S, Zeledon M, Sawa A. Seshadri S, et al. Neurobiol Dis. 2013 May;53:26-35. doi: 10.1016/j.nbd.2013.01.009. Epub 2013 Jan 18. Neurobiol Dis. 2013. PMID: 23336981 Free PMC article. Review. - Delineation of multiple subpallial progenitor domains by the combinatorial expression of transcriptional codes.
Flames N, Pla R, Gelman DM, Rubenstein JL, Puelles L, Marín O. Flames N, et al. J Neurosci. 2007 Sep 5;27(36):9682-95. doi: 10.1523/JNEUROSCI.2750-07.2007. J Neurosci. 2007. PMID: 17804629 Free PMC article. - Novel Perspectives on the Development of the Amygdala in Rodents.
Aerts T, Seuntjens E. Aerts T, et al. Front Neuroanat. 2021 Dec 9;15:786679. doi: 10.3389/fnana.2021.786679. eCollection 2021. Front Neuroanat. 2021. PMID: 34955766 Free PMC article. Review.
References
- Anderson SA, Qiu M, Bulfone A, Eisenstat DD, Meneses J, Pedersen R, Rubenstein JL (1997a) Mutations of the homeobox genes Dlx-1 and Dlx-2 disrupt the striatal subventricular zone and differentiation of late born striatal neurons. Neuron 19: 27-37. - PubMed
- Anderson SA, Eisenstat DD, Shi L, Rubenstein JL (1997b) Interneuron migration from basal forebrain to neocortex: dependence on Dlx genes. Science 278: 474-476. - PubMed
- Anderson SA, Marin O, Horn C, Jennings K, Rubenstein JL (2001) Distinct cortical migrations from the medial and lateral ganglionic eminences. Development 128: 353-363. - PubMed
Publication types
MeSH terms
Substances
LinkOut - more resources
Full Text Sources
