Control of dTTP pool size by anaphase promoting complex/cyclosome is essential for the maintenance of genetic stability - PubMed (original) (raw)
Control of dTTP pool size by anaphase promoting complex/cyclosome is essential for the maintenance of genetic stability
Po-Yuan Ke et al. Genes Dev. 2005.
Abstract
Anaphase promoting complex/cyclosome (APC/C)-mediated proteolysis is essential for chromosome segregation, mitotic exit, and G1 entry. Here, we show the importance of APC/C in the control of dTTP pool size in mammalian cells. Two enzymes, thymidine kinase 1 (TK1) and thymidylate kinase (TMPK), involved in dTTP formation are the targets of the APC/C pathway. We demonstrate that TMPK is recognized and degraded by APC/C-Cdc20/Cdh1-mediated pathways from mitosis to the early G1 phase, whereas TK1 is targeted for degradation by APC/C-Cdh1 after mitotic exit. Overexpression of wild-type TK1 and TMPK induces a four- to fivefold increase in the cellular dTTP pool without promoting spontaneous mutations in the hprt (hypoxanthine-guanine phosphoribosyl transferase) gene. In contrast, coexpression of nondegradable TK1 and TMPK expands the dTTP pool size 10-fold accompanied by a drastic dNTP pool imbalance. Most interestingly, disruption of APC/C proteolysis of TK1 and TMPK leads to growth retardation and a striking increase in gene mutation rate. We conclude that down-regulation of dTTP pool size by the APC/C pathway during mitosis and the G1 phase is an essential means to maintain a balanced dNTP pool and to avoid genetic instability.
Figures
Figure 1.
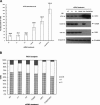
Depletion of either Cdc20 or Cdh1 increases the intracellular dTTP pool size. (A) HeLa cells were transfected with siRNAs corresponding to nonrelevant firefly mRNA (C1 and C2) and Cdc20, Cdh1, or Cdh1 mRNA as indicated. (NT) No siRNA transfection; (Cdc20/Cdh1 siRNAs) combination of Cdc20 and Cdh1 siRNAs transfection. Forty-eight hours after transfection, cells were extracted for dTTP pool size determination and Western blotting with specific antibodies. Each data point represents a mean ± S.D. of three separate experiments. (B) The cell cycle profiles of siRNA-treated cells as indicated were analyzed by flow cytometry and the results were expressed as percentage of cells in G1, S, and G2/M phases.
Figure 2.
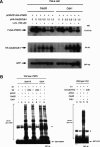
hTMPK is a novel substrate of APC/C–Cdc20 and APC/C–Cdh1. (A) HeLa cells were transfected with pCMV2FLAG-hTMPK and pEGFP with different amounts of either pHA-Cdc20 or pHA-Cdh1 as indicated. Empty vector was added to the transfection mixture to adjust the total amount of DNA for each transfection to be equal. Cells were treated without (–) or with (+) LLnL for 6 h before harvesting. Followed by transfection for 24 h, cells were extracted for Western blotting analysis. Expression of GFP indicated the transfection efficiency among different samples. (B) In vitro polyubiquitinylation was performed using GST-hTMPK or GST-hTK1 as the substrate in a reaction mixture containing E1, E2 (UbcX or UbCH10), APC/C, Cdc20, or Cdh1 as indicated. The CS represents the C114S mutant of Ubc10. The samples were separated by SDS-PAGE (5%–15% gradient) and analyzed by Western blotting using anti-GST antibody as indicated. The asterisk indicates the dimmer forms of hTK1 and hTMPK.
Figure 3.
hTMPK is degraded in M and early G1 phase. (A) HeLa S3 cells were arrested by nocodazole treatment for 20 h, followed by replenishment with fresh medium to release cells from the G2/M arrest. Extracts prepared from HeLa cells released from G2/M arrest at various time points as indicated were analyzed by Western blotting with the specific antibodies. (Asn) Asynchronized state. (B) S35-methionine-labeled Myc-hTMPK was incubated with M- and G1-phase extracts as described in Materials and Methods for different times as indicated. Purified nondegradable cyclin B1 (ΔN90 cyclin B1) and hTK1 proteins were added in each extract to indicate the specificity of degradation in the assay. (C) Purified GST-tagged (1–90) cyclin B1 and (ΔN90) cyclin B1 were each added to the M extract for in vitro degradation assay of S35-methionine-labeled Myc-hTMPK. (D) Purified GST-tagged wild-type and KEN mt hTK1 were each added to the G1 extract for in vitro degradation assay of S35-methionine-labeled Myc-hTMPK. (E) HeLa cells were transfected with control, Cdc20, and Cdh1 siRNAs as indicated. (Cdc20/Cdh1) Combination of Cdc20 and Cdh1 siRNA transfection. Thirty-six hours after transfection, cells were metabolically labeled with 35S-methionine (250 μCi/mL) for 30 min, followed by chasing for 0 and 12 h. Cell lysates were immunoprecipitated by anti-hTK1 and anti-hTMPK antibodies separately. The immunocomplexes were resolved on 12% SDS-PAGE, followed by Western blotting and autoradiography. Normal rabbit IgG (IgG) was used a negative control for immunoprecipitation.
Figure 4.
Fluctuation of dTTP pool size during mitotic progression. HeLa S3 cells were arrested by nocodazole as described in the legend for Figure 3A. At different time points after release from mitotic block, cells were extracted for dTTP pool size determination as described in Materials and Methods. Each data point represents a mean ± S.D. of three separate experiments. (Asn) Asynchronized state.
Figure 5.
TMPK is required for increment of the dTTP pool induced by inactivation of APC/C. HeLa cells were transfected with siRNAs as indicated. Forty-eight hours after transfection, cells were extracted for determination of dTTP pool size and Western blotting analysis.
Figure 6.
D-box-dependent recognition of hTMPK by Cdc20 and Cdh1. (A) Schematic representation of mutants carrying mutation in various potential destruction signal motifs of hTMPK as indicated. (B) Cell extracts were prepared from LM-TK– cells that were transfected with wild-type (wt) or various mutants of pCMV2FLAG-hTMPK as indicated with (+) or without (–) pHA-Cdh1 or pHA-Cdc20, followed by SDS-PAGE and Western blotting analysis as described in the legend for Figure 2A. (C) In vitro polyubiquitinylation reactions of wild-type, D2 mt, KEN mt, and D2/KEN mt of hTMPK were performed as described in the legend for Figure 2B. The asterisk indicates the dimer forms of hTK1 and hTMPK.
Figure 7.
Simultaneous disruption of hTK1 and hTMPK degradation elevates the dTTP pool size. (A) NIH 3T3 stable line cells were established as described in Materials and Methods. Cells were extracted for dTTP pool size measurement and Western blotting analysis as described in the legend for Figure 1. (B) NIH 3T3 cells stably expressing wild-type (WT/WT) and nondegradable mutant (KEN/D2) hTK1 and hTMPK were serum deprived and stimulated as indicated. (Asn) Asynchronized state; (SD) serum deprivation 24 h; (SD → SS) serum stimulation for 24 h after 24-h serum deprivation. Cells were harvested for Western blotting analysis and dTTP pool size determination as described in the legend for Figure 5. (C) Four dNTP pool sizes were determined in extracts from various 3T3 stable line cells (Mock, WT/WT, and KEN/D2) as described in Materials and Methods. Each data point represents a mean ± S.D. of three separate experiments. (D) The ratio of dGTP to dCTP in each cell line was calculated by dividing pool size of dGTP by that of dCTP. The dNTP pool imbalance induction folds were expressed by normalization of the dGTP/dCTP ratio of WT/WT and KEN/D2 cells with that of Mock cells.
Figure 8.
Knockdown of Cdc20/Cdh1 in HeLa cells induces dNTP pool imbalance. HeLa cells were transfected with siRNAs against Cdc20 and Cdh1 simultaneously as described in the legend for Figure 1. Cells were extracted for the four dNTP pool size determinations as described in Materials and Methods. Each data point represents a mean ± S.D. of three separate experiments. (Control) Control siRNA transfection.
Figure 9.
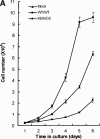
Disruption of APC/C-mediated degradation of hTK1/hTMPK affects growth rate and induces genetic instability. (A) Growth analysis of various 3T3 stable line cells (Mock, WT/WT, and KEN/D2) was performed as described in Materials and Methods. Results shown here represent the average ± S.D. from three separate experiments. (B) Various 3T3 stable line (Mock, WT/WT, and KEN/D2) cells (3 × 10⁵) were plated onto the culture dish in 6-TG (5 μg/mL) containing medium (+) for analyzing spontaneous mutation in the hprt locus. For comparing the colony formation efficiency for each line, 103 cells were in parallel grown in the medium without 6-TG (–).
Similar articles
- Mitotic control of dTTP pool: a necessity or coincidence?
Hu CM, Chang ZF. Hu CM, et al. J Biomed Sci. 2007 Jul;14(4):491-7. doi: 10.1007/s11373-007-9175-1. Epub 2007 May 25. J Biomed Sci. 2007. PMID: 17525869 Review. - Hiding human thymidine kinase 1 from APC/C-mediated destruction by thymidine binding.
Ke PY, Hu CM, Chang YC, Chang ZF. Ke PY, et al. FASEB J. 2007 Apr;21(4):1276-84. doi: 10.1096/fj.06-7272com. Epub 2007 Jan 16. FASEB J. 2007. PMID: 17227951 - KEN-box-dependent degradation of the Bub1 spindle checkpoint kinase by the anaphase-promoting complex/cyclosome.
Qi W, Yu H. Qi W, et al. J Biol Chem. 2007 Feb 9;282(6):3672-9. doi: 10.1074/jbc.M609376200. Epub 2006 Dec 11. J Biol Chem. 2007. PMID: 17158872 - The ubiquitin ligase APC(Cdh1) is required to maintain genome integrity in primary human cells.
Engelbert D, Schnerch D, Baumgarten A, Wäsch R. Engelbert D, et al. Oncogene. 2008 Feb 7;27(7):907-17. doi: 10.1038/sj.onc.1210703. Epub 2007 Aug 13. Oncogene. 2008. PMID: 17700535 - Anaphase-promoting complex-dependent proteolysis of cell cycle regulators and genomic instability of cancer cells.
Wäsch R, Engelbert D. Wäsch R, et al. Oncogene. 2005 Jan 6;24(1):1-10. doi: 10.1038/sj.onc.1208017. Oncogene. 2005. PMID: 15637585 Review.
Cited by
- Nonparametric Bayesian evaluation of differential protein quantification.
Serang O, Cansizoglu AE, Käll L, Steen H, Steen JA. Serang O, et al. J Proteome Res. 2013 Oct 4;12(10):4556-65. doi: 10.1021/pr400678m. Epub 2013 Sep 11. J Proteome Res. 2013. PMID: 24024742 Free PMC article. - The effect of mitochondrial dysfunction on cytosolic nucleotide metabolism.
Desler C, Lykke A, Rasmussen LJ. Desler C, et al. J Nucleic Acids. 2010 Aug 24;2010:701518. doi: 10.4061/2010/701518. J Nucleic Acids. 2010. PMID: 20862377 Free PMC article. - Glutathione determines chronic myeloid leukemia vulnerability to an inhibitor of CMPK and TMPK.
Huang CY, Chung YH, Wu SY, Wang HY, Lin CY, Yang TJ, Fang JM, Hu CM, Chang ZF. Huang CY, et al. Commun Biol. 2024 Jul 10;7(1):843. doi: 10.1038/s42003-024-06547-1. Commun Biol. 2024. PMID: 38987326 Free PMC article. - Early detection of pemetrexed-induced inhibition of thymidylate synthase in non-small cell lung cancer with FLT-PET imaging.
Chen X, Yang Y, Berger I, Khalid U, Patel A, Cai J, Farwell MD, Langer C, Aggarwal C, Albelda SM, Katz SI. Chen X, et al. Oncotarget. 2017 Apr 11;8(15):24213-24223. doi: 10.18632/oncotarget.12085. Oncotarget. 2017. PMID: 27655645 Free PMC article. - APC/CCdh1-dependent proteolysis of USP1 regulates the response to UV-mediated DNA damage.
Cotto-Rios XM, Jones MJ, Busino L, Pagano M, Huang TT. Cotto-Rios XM, et al. J Cell Biol. 2011 Jul 25;194(2):177-86. doi: 10.1083/jcb.201101062. Epub 2011 Jul 18. J Cell Biol. 2011. PMID: 21768287 Free PMC article.
References
- Bashir T., Dorrello, N.V., Amador, V., Guardavaccaro, D., and Pagano, M. 2004. Control of the SCFskp2-cks1 ubiquitin ligase by the APC/CCdh1 ubiquitin ligase. Nature 428: 190–193. - PubMed
- Bjursell G. and Reichard, P. 1973. Effects of thymidine on deoxyribonucleoside triphosphate pools and deoxyribonucleic acid synthesis in Chinese hamster ovary cells. J. Biol. Chem. 248: 3904–3909. - PubMed
- Bolderson E., Scorah, J., Helleday, T., Smythe, C., and Meuth, M. 2004. ATM is required for the cellular response to thymidine induced replication fork stress. Hum. Mol. Genet. 13: 2937–2945. - PubMed
Publication types
MeSH terms
Substances
LinkOut - more resources
Full Text Sources
Other Literature Sources
Miscellaneous


