Complete loss of Ndel1 results in neuronal migration defects and early embryonic lethality - PubMed (original) (raw)
Complete loss of Ndel1 results in neuronal migration defects and early embryonic lethality
Shinji Sasaki et al. Mol Cell Biol. 2005 Sep.
Abstract
Regulation of cytoplasmic dynein and microtubule dynamics is crucial for both mitotic cell division and neuronal migration. NDEL1 was identified as a protein interacting with LIS1, the protein product of a gene mutated in the lissencephaly. To elucidate NDEL1 function in vivo, we generated null and hypomorphic alleles of Ndel1 in mice by targeted gene disruption. Ndel1(-/-) mice were embryonic lethal at the peri-implantation stage like null mutants of Lis1 and cytoplasmic dynein heavy chain. In addition, Ndel1(-/-) blastocysts failed to grow in culture and exhibited a cell proliferation defect in inner cell mass. Although Ndel1(+/-) mice displayed no obvious phenotypes, further reduction of NDEL1 by making null/hypomorph compound heterozygotes (Ndel1(cko/-)) resulted in histological defects consistent with mild neuronal migration defects. Double Lis1(cko/+)-Ndel1(+/-) mice or Lis1(+/-)-Ndel1(+/-) mice displayed more severe neuronal migration defects than Lis1(cko/+)-Ndel1(+/)(+) mice or Lis1(+/-)-Ndel1(+/+) mice, respectively. We demonstrated distinct abnormalities in microtubule organization and similar defects in the distribution of beta-COP-positive vesicles (to assess dynein function) between Ndel1 or Lis1-null MEFs, as well as similar neuronal migration defects in Ndel1- or Lis1-null granule cells. Rescue of these defects in mouse embryonic fibroblasts and granule cells by overexpressing LIS1, NDEL1, or NDE1 suggest that NDEL1, LIS1, and NDE1 act in a common pathway to regulate dynein but each has distinct roles in the regulation of microtubule organization and neuronal migration.
Figures
FIG. 1.
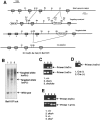
Generation of a gene-disrupted mouse of Ndel1 [Ndel1 cko(III), Ndel1 ko(III)]. (A) Summary of targeting strategy for the Ndel1 locus. A diagrammatic representation of the targeting vector and genomic loci of Ndel1 gene is shown. Exons are represented by gray boxes. In this gene targeting, Ndel1 function was expected to be intact (Ndel1 cko(III)). Exon 3 was removed by CRE-mediated recombination to inactivate Ndel1 function [Ndel1 _ko(III)_]. (B) Southern blot analysis of tail DNA from wild-type (+/+, lane 1) and heterozygous mutant (+/−, lanes 2 and 3) animals. (C) Southern blot analysis of tail DNA from deletion mutant (+/del, lane 1), wild-type (+/+, lane 2), and heterozygous mutant (+/loxP, lane 3) mice. CRE-mediated deletion of exon 3 was evaluated by Southern blotting. Note the difference in band sizes after deletion. We used Ndel1 ko(III) as a Ndel1 +/− in the all experiment.
FIG. 2.
Generation of another gene disrupted mouse of Ndel1 [Ndel1 _cko(IV)_]. (A) Summary of the second targeting strategy for the Ndel1 locus. A diagrammatic representation of the targeting vector and genomic loci of Ndel1 gene is shown. PGK-neo was inserted into intron IV, which was larger than intron III. Exon IV was removed by CRE-mediated recombination. (B) Southern blot analysis of ES cell DNA. By digestion with Bst1107I, the wild-type allele, the targeted allele that lost the loxP site, and the targeted allele that preserved the loxP site were discriminated (arrows). (C) Using this conditional KO line, we were able to make conditional homozygotes. Primers are shown on the right side (arrows). (D) CRE expression efficiently removed the DNA fragment that was demarcated by loxP sequence. (E) We mated new conditional KO mice and KO mice to make compound heterozygotes. Primers are shown on the right side. Compound heterozygotes were completely viable and fertile. We used Ndel1 cko(IV) as Ndel1 cko/+ in all experiments.
FIG. 3.
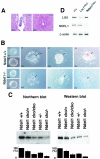
Embryonic lethality of _Ndel1_-null mutants. (A) Homozygous mutants of Ndel1 were not observed, suggesting that null mutants are embryonic lethal. Normal (left) and degenerated deciduas (right) resulting from the Ndel1 +/− cross were sectioned at E5.5 and stained with hematoxylin and eosin. ec, ectoplacental cone; ee, extra-embryonic ectoderm; e, epiblast. (B) Wild-type (upper) and homozygous (lower) blastocysts were isolated from a heterozygous cross and cultured. Both blastocysts hatched and differentiated into trophoblast (tr) and inner cell mass (ICM). The inner cell mass of homozygotes exhibited poor growth and degenerated. (C) Quantitation of the amount of Ndel1 expression in the various genotypes. Northern blot (left side) and Western blot (right side) are shown. Expression was calculated by densitometry compared to the wild type. We repeated three independent experiments, and the results were highly reproducible. (D) Expression of LIS1 or NDEL1 in Ndel1 KO mice or Lis1 KO mice was examined. Total protein was extracted from a brain of E15.5 embryo and subjected to Western blotting. There was no obvious difference in LIS1 or NDEL1 expression in Ndel1 or Lis1 KO mice, respectively.
FIG. 4.
Synergistic effects of Lis1 and Ndel1 mutations on brain morphogenesis. Genotypes are shown at the top of the panels. (A) Midsagittal sections of cerebral cortex (upper) and hippocampus (lower). Lis1 cko/+ or Ndel1 +/− samples were grossly normal. In contrast, mild cell dispersion of CA3 region was observed in Ndel1 cko/− compound heterozygotes or Lis1 cko/+ and Ndel1 +/− double heterozygotes (arrowheads). (B) Loss of cell compaction (arrowheads) in CA3 region was clearly observed by NeuN staining. (C) Abnormal corticogenesis was characterized by fragmentation of the subplate layer (arrowheads) which was visualized by MAP2 staining (upper panels) and chondroitin sulfate proteoglycan staining (lower panels) at E15.5. MZ, marginal zone; CP, cortical plate; SP, subplate; IZ, intermediate zone.
FIG. 5.
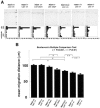
Examination of migration defects of Lis1 and Ndel1 mutants. (A) BrdU birth dating analysis reveals neuronal migration defects in the cross of Ndel1 +/− and Ndel1 cko/+, in the cross of Lis1 cko/+ and Ndel1 +/−, or in the cross of Lis1 +/− and Ndel1 +/−. Genotypes are described at the top of the panels. Mice were injected with BrdU at E15.5 and sacrificed at P0. Quantitative analysis was performed by measuring the distribution of BrdU-labeled cells in each bin which equally divided the cortex from the molecular layer (ML) to the subplate (SP). The staining patterns are representative of three different experiments. Note the shift downward toward the ventricular side as Lis1 or Ndel1 dosage was reduced. CPs, cortical plate surface; CPi, cortical plate inner. (B) Summary of mean migration distance of each genotype.
FIG. 6.
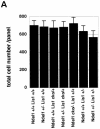
Specific defect of corticogenesis and apoptotic cell death by Lis1 or Ndel1 disruption. (A) Quantitation of cell number of the cortex in various combination of Lis1 KO and/or Ndel1 KO mice. After hematoxylin and eosin staining of the sagittal sections of the cortexes of 8W adult mice, samples were subjected to cell counting. The cell counts of three corresponding sections in each genotype were determined. The histogram indicates the cell number. Mild reduction of cell number was observed in Lis1 +/−/Ndel1 +/+ and Lis1 +/−/Ndel1 +/− mutants. (B) Cortical phenotypes of Lis1 and/or Ndel1 mutants (adult, 8W) were examined by layer specific makers, calbindin (layer 2 and 3) and c-Neu (layer 5). We measured five independent sides from each genotype. Total number of calbindin-positive cells is shown at the bottom of each panel. Calbindin-positive cells were more dispersed in Ndel1 +/−/Lis1 cko/+, Ndel1 cko/− /Lis1 +/+, Ndel1 +/+ /Lis1 +/−, and Ndel1 +/− /Lis1 +/− mice, whereas c-Neu-positive cells were more broadly distributed in Ndel1 cko/− /Lis1 +/+, Ndel1 +/+ /Lis1 +/−, and Ndel1 +/− /Lis1 +/− mice. Although the distribution became more broad and overlapped, inversion of layering was not observed. Genotypes are noted at the top of the panel. (C) Histogram plots of the relative frequency of calbindin-positive cells and c-Neu-positive cells to the total cell number in each genotype. Notably, later-migrating neurons (calbindin-positive cells) were more sensitive to LIS1 and NDEL1 dosage. (D) Apoptotic cell death was examined by TUNEL stainong at E11.5 and E15.5. We measured five independent sides from each genotype. The total number of calbindin-positive cells is shown at the bottom of each panel. (E) Histogram plot of the relative frequency of TUNEL-positive cell to the total number of cells in each genotype. There was no obvious increase of cell death in early generated neurons. In contrast, significant enhancement of cell death was observed in neurons generated later, a finding consistent with loss of calbindin-positive cells, and cell death was highly correlated with the reduction of LIS1 dosage.
FIG.7.
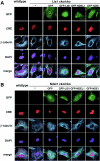
Disruption of microtubule organization and distribution of β-COP-positive vesicles in _Lis1_- or _Ndel1_-null MEFs. Aberrant microtubule organization and abnormal distribution of β-COP-positive vesicles in Lis1 or _Ndel1_-null MEFs generated by CRE-mediated recombination. Cotransfected plasmids for rescue were shown on the top. (A and B) The loss of LIS1 causes a redistribution and an enrichment of microtubules near the nucleus (A), whereas loss of NDEL1 results in amorphous microtubules (B). Perinuclear accumulation of microtubules in _Lis1_-null MEFs was only rescued by GFP-LIS1 expression (see panel A). GFP-NDEL1 expression also rescued the amorphous microtubule organization in _Ndel1_-null MEFs, but GFP-LIS1 and GFP-NDE1 were less effective (see panel B). To address dynein regulation by LIS1 and NDEL1, we examined the distribution of β-COP-positive vesicles, which display juxtanuclear localization in a dynein-dependent fashion. (C and D) The predominant juxtanuclear staining pattern was disrupted in _Lis1_-null MEFs (C) and in _Ndel1_-null MEFs (D), resulting in a homogeneous distribution accompanied by punctuate accumulation. Loss of this Golgi pattern by Lis1 inactivation was only rescued by exogenous expression of GFP-LIS1 (see panel C). In contrast, loss of the Golgi pattern by Ndel1 inactivation was efficiently rescued by exogenous expression of GFP-LIS1, GFP-NDEL1, and GFP-NDE1 (see panel D).
FIG.8.
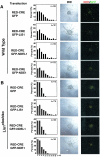
Migration distance in _Lis1_- or _Ndel1_-null neurons determined by reaggregation assay. Granular neurons were isolated from P3 neonatal pups and subjected to the neuronal migration reaggregation assay. Lis1 or Ndel1 was inactivated by CRE-mediated recombination. Cotransfected plasmids for rescue are shown on the left side. The migration distance of each neurons after 12 h was binned. (A) Wild-type neurons expressing RFP-CRE display normal migration distance compared to untransfected neurons. Cotransfection of GFP-LIS1 mildly enhanced migration, whereas GFP-NDEL1 or GFP-NDE1 did not have obvious effect. (B and C) Lis1 (B)- or Ndel1 (C)-null neurons display a shift in the distribution of bins toward the right. Migration defects in _Lis1_-null neurons were only rescued by exogenous expression of GFP-LIS1. Migration defects in _Ndel1_-null neurons were rescued by exogenous expression of GFP-LIS1, GFP-NDEL1, and GFP-NDE1, but GFP-LIS1 and GFP-NDE1 were less effective (see panel C). Mean migration distances are summarized at the bottom. n, Number of neurons measured for each examination. (D) Summary of mean migration distance of each genotype.
Similar articles
- Distinct dose-dependent cortical neuronal migration and neurite extension defects in Lis1 and Ndel1 mutant mice.
Youn YH, Pramparo T, Hirotsune S, Wynshaw-Boris A. Youn YH, et al. J Neurosci. 2009 Dec 9;29(49):15520-30. doi: 10.1523/JNEUROSCI.4630-09.2009. J Neurosci. 2009. PMID: 20007476 Free PMC article. - Recruitment of katanin p60 by phosphorylated NDEL1, an LIS1 interacting protein, is essential for mitotic cell division and neuronal migration.
Toyo-Oka K, Sasaki S, Yano Y, Mori D, Kobayashi T, Toyoshima YY, Tokuoka SM, Ishii S, Shimizu T, Muramatsu M, Hiraiwa N, Yoshiki A, Wynshaw-Boris A, Hirotsune S. Toyo-Oka K, et al. Hum Mol Genet. 2005 Nov 1;14(21):3113-28. doi: 10.1093/hmg/ddi339. Epub 2005 Oct 3. Hum Mol Genet. 2005. PMID: 16203747 - Ndel1 operates in a common pathway with LIS1 and cytoplasmic dynein to regulate cortical neuronal positioning.
Shu T, Ayala R, Nguyen MD, Xie Z, Gleeson JG, Tsai LH. Shu T, et al. Neuron. 2004 Oct 14;44(2):263-77. doi: 10.1016/j.neuron.2004.09.030. Neuron. 2004. PMID: 15473966 - [Molecular mechanism of lissencephaly--how LIS1 and NDEL1 regulate cytoplasmic dynein?].
Hirotsune S. Hirotsune S. Brain Nerve. 2008 Apr;60(4):375-81. Brain Nerve. 2008. PMID: 18421979 Review. Japanese. - Lissencephaly and LIS1: insights into the molecular mechanisms of neuronal migration and development.
Wynshaw-Boris A. Wynshaw-Boris A. Clin Genet. 2007 Oct;72(4):296-304. doi: 10.1111/j.1399-0004.2007.00888.x. Clin Genet. 2007. PMID: 17850624 Review.
Cited by
- PRMT5 Interacting Partners and Substrates in Oligodendrocyte Lineage Cells.
Dansu DK, Liang J, Selcen I, Zheng H, Moore DF, Casaccia P. Dansu DK, et al. Front Cell Neurosci. 2022 Mar 17;16:820226. doi: 10.3389/fncel.2022.820226. eCollection 2022. Front Cell Neurosci. 2022. PMID: 35370564 Free PMC article. - Functional dissection of LIS1 and NDEL1 towards understanding the molecular mechanisms of cytoplasmic dynein regulation.
Torisawa T, Nakayama A, Furuta K, Yamada M, Hirotsune S, Toyoshima YY. Torisawa T, et al. J Biol Chem. 2011 Jan 21;286(3):1959-65. doi: 10.1074/jbc.M110.169847. Epub 2010 Oct 29. J Biol Chem. 2011. PMID: 21036906 Free PMC article. - Ndel1 promotes axon regeneration via intermediate filaments.
Toth C, Shim SY, Wang J, Jiang Y, Neumayer G, Belzil C, Liu WQ, Martinez J, Zochodne D, Nguyen MD. Toth C, et al. PLoS One. 2008 Apr 23;3(4):e2014. doi: 10.1371/journal.pone.0002014. PLoS One. 2008. PMID: 18431495 Free PMC article. - Nudel and FAK as antagonizing strength modulators of nascent adhesions through paxillin.
Shan Y, Yu L, Li Y, Pan Y, Zhang Q, Wang F, Chen J, Zhu X. Shan Y, et al. PLoS Biol. 2009 May 12;7(5):e1000116. doi: 10.1371/journal.pbio.1000116. Epub 2009 May 26. PLoS Biol. 2009. PMID: 19492042 Free PMC article. - Decoding the molecular mechanisms of neuronal migration using in utero electroporation.
Tabata H, Nagata K. Tabata H, et al. Med Mol Morphol. 2016 Jun;49(2):63-75. doi: 10.1007/s00795-015-0127-y. Epub 2015 Nov 25. Med Mol Morphol. 2016. PMID: 26608533 Review.
References
- Chae, T., Y. T. Kwon, R. Bronson, P. Dikkes, E. Li, and L. H. Tsai. 1997. Mice lacking p35, a neuronal specific activator of Cdk5, display cortical lamination defects, seizures, and adult lethality. Neuron 18:29-42. - PubMed
- Deng, C., A. Wynshaw-Boris, F. Zhou, A. Kuo, and P. Leder. 1996. Fibroblast growth factor receptor 3 is a negative regulator of bone growth. Cell 84:911-921. - PubMed
- Dobyns, W. B. 1987. Developmental aspects of lissencephaly and the lissencephaly syndromes. Birth Defects 23:225-241. - PubMed
- Dobyns, W. B., O. Reiner, R. Carrozzo, and D. H. Ledbetter. 1993. Lissencephaly: a human brain malformation associated with deletion of the LIS1 gene located at chromosome 17p13. JAMA 23:2838-2842. - PubMed
Publication types
MeSH terms
Substances
LinkOut - more resources
Full Text Sources
Molecular Biology Databases
Research Materials
Miscellaneous

