Glucocorticoid receptor-dependent gene regulatory networks - PubMed (original) (raw)
Glucocorticoid receptor-dependent gene regulatory networks
Phillip Phuc Le et al. PLoS Genet. 2005 Aug.
Abstract
While the molecular mechanisms of glucocorticoid regulation of transcription have been studied in detail, the global networks regulated by the glucocorticoid receptor (GR) remain unknown. To address this question, we performed an orthogonal analysis to identify direct targets of the GR. First, we analyzed the expression profile of mouse livers in the presence or absence of exogenous glucocorticoid, resulting in over 1,300 differentially expressed genes. We then executed genome-wide location analysis on chromatin from the same livers, identifying more than 300 promoters that are bound by the GR. Intersecting the two lists yielded 53 genes whose expression is functionally dependent upon the ligand-bound GR. Further network and sequence analysis of the functional targets enabled us to suggest interactions between the GR and other transcription factors at specific target genes. Together, our results further our understanding of the GR and its targets, and provide the basis for more targeted glucocorticoid therapies.
Conflict of interest statement
Competing interests. The authors have declared that no competing interests exist.
Figures
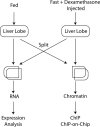
Figure 1. Experimental Paradigm for Orthogonal Analysis of Glucocorticoid Receptor Targets
Treatment mice were fasted overnight, then given intraperitoneal injections with dexamethasone. Treatment and control liver lobes were split in half and processed for both RNA and chromatin. RNA was subjected to microarray analysis using the PancChip 5.0 cDNA microarray, which contains over 13,000 transcripts. Location analysis was performed by immunoprecipitating with antiserum raised against the GR. ChIP material was amplified, fluorescently labeled, and hybridized against sheared genomic DNA using the Mouse PromoterChip BCBC-3.0 promoter microarray, which contains approximately 7,000 genomic promoter elements.
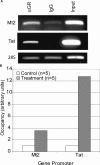
Figure 2. ChIP Identifies Known GR Targets in Liver
(A) Agarose gel electrophoresis of PCR products for the known GREs in Mt2 and Tat confirm the specificity of the anti-GR antibody (sc-1002, Santa Cruz) compared to the control preimmune IgG. The PCR product for the genomic locus encoding the 28S ribosomal RNA shows that equal amounts of DNA were loaded into each reaction. (B) QPCR was used to measure the enrichment of Mt2 and Tat in chromatin immunoprecipitated with the anti-GR antiserum from five dexamethasone-treated samples compared to five fed controls, as described in Materials and Methods. The 28S PCR product was used to normalize the samples.
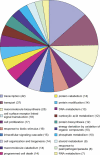
Figure 3. Functional Categories of the Genes Generated by Location Analysis
Location analysis was performed using antiserum against the GR. Three treated and five control samples were amplified, fluorescently labeled, and hybridized to the Mouse PromoterChip BCBC-3.0 promoter microarray in a common reference design. Standard statistical methods identified 302 promoter regions significantly enriched in the treated samples compared to the fed controls (see Materials and Methods). The GO level 4 functional category for each gene was retrieved and the top 20 categories are shown. Note that some genes belong to multiple GO categories.
Figure 4. Quantitative PCR Confirms GR Targets Identified by Location Analysis
The enrichment of GR targets identified by location analysis was measured in the original immunoprecipitated material by QPCR. The graph shows the fold-enrichment of five dexamethasone-treated samples compared to five fed controls. Of fourteen randomly selected GR targets, 12 showed statistically significant enrichment. Fold-enrichment and _p_-values were calculated as described in Materials and Methods. *p < 0.05, **p < 0.01.
Figure 5. Intersection of Expression Data and Location Analysis
Of the genes common to both the cDNA microarray and the promoter microarray, 498 were differentially expressed and 235 were bound by the GR. Intersecting the two lists produced 53 genes in common. This list represents direct, functional targets of the GR in hepatocytes.
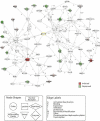
Figure 6. A Regulatory Network for the GR
Pathway analysis was seeded with the 53 differentially expressed and GR-bound genes, plus the GR itself, as described in Materials and Methods. Genes in colored, bold text were in the seed set, while all others were brought into the network by the pathway analysis program based on their known relationships to the genes in the seed set. Color indicates induction (red) or repression (green) of expression.
Similar articles
- Glucocorticoid receptor-mediated chromatin remodeling in vivo.
Deroo BJ, Archer TK. Deroo BJ, et al. Oncogene. 2001 May 28;20(24):3039-46. doi: 10.1038/sj.onc.1204328. Oncogene. 2001. PMID: 11420719 Review. - Identification of novel glucocorticoid receptor-regulated genes involved in epidermal homeostasis and hair follicle differentiation.
Donet E, Bayo P, Calvo E, Labrie F, Pérez P. Donet E, et al. J Steroid Biochem Mol Biol. 2008 Jan;108(1-2):8-16. doi: 10.1016/j.jsbmb.2007.05.033. Epub 2007 Sep 7. J Steroid Biochem Mol Biol. 2008. PMID: 17935973 - Repression of the human glycoprotein hormone alpha-subunit gene by glucocorticoids: evidence for receptor interactions with limiting transcriptional activators.
Chatterjee VK, Madison LD, Mayo S, Jameson JL. Chatterjee VK, et al. Mol Endocrinol. 1991 Jan;5(1):100-10. doi: 10.1210/mend-5-1-100. Mol Endocrinol. 1991. PMID: 1708098 - How glucocorticoid receptors modulate the activity of other transcription factors: a scope beyond tethering.
Ratman D, Vanden Berghe W, Dejager L, Libert C, Tavernier J, Beck IM, De Bosscher K. Ratman D, et al. Mol Cell Endocrinol. 2013 Nov 5;380(1-2):41-54. doi: 10.1016/j.mce.2012.12.014. Epub 2012 Dec 23. Mol Cell Endocrinol. 2013. PMID: 23267834 Review. - Selective recruitment of p160 coactivators on glucocorticoid-regulated promoters in Schwann cells.
Grenier J, Trousson A, Chauchereau A, Amazit L, Lamirand A, Leclerc P, Guiochon-Mantel A, Schumacher M, Massaad C. Grenier J, et al. Mol Endocrinol. 2004 Dec;18(12):2866-79. doi: 10.1210/me.2004-0241. Epub 2004 Aug 26. Mol Endocrinol. 2004. PMID: 15331759
Cited by
- Omega-3 fatty acids mitigate histological changes and modulate the expression of ACACA, PFK1 and ET-1 genes in broiler chickens under environmental stress: a pulmonary artery, cardiomyocyte and liver study.
Rahbari S, Sharifi SD, Salehi A, Pahlavan S, Honarbakhsh S. Rahbari S, et al. Poult Sci. 2024 Oct 9;103(12):104387. doi: 10.1016/j.psj.2024.104387. Online ahead of print. Poult Sci. 2024. PMID: 39476610 Free PMC article. - Sexual dimorphism of circadian liver transcriptome.
Astafev AA, Mezhnina V, Poe A, Jiang P, Kondratov RV. Astafev AA, et al. iScience. 2024 Mar 12;27(4):109483. doi: 10.1016/j.isci.2024.109483. eCollection 2024 Apr 19. iScience. 2024. PMID: 38550984 Free PMC article. - Senescence and the stress axis: a constraint or a trade-off of reproduction in mammals with fast and slow life histories.
Delehanty B, Boonstra R. Delehanty B, et al. Proc Biol Sci. 2023 Nov 8;290(2010):20231464. doi: 10.1098/rspb.2023.1464. Epub 2023 Nov 8. Proc Biol Sci. 2023. PMID: 37935366 Free PMC article. - Single-cell transcriptomics and chromatin accessibility profiling elucidate the kidney-protective mechanism of mineralocorticoid receptor antagonists.
Abedini A, Sánchez-Navaro A, Wu J, Klötzer KA, Ma Z, Poudel B, Doke T, Balzer MS, Frederick J, Cernecka H, Liu H, Liang X, Vitale S, Kolkhof P, Susztak K. Abedini A, et al. J Clin Invest. 2024 Jan 2;134(1):e157165. doi: 10.1172/JCI157165. J Clin Invest. 2024. PMID: 37906287 Free PMC article. - In Vivo and In Vitro Evidence for an Interplay between the Glucocorticoid Receptor and the Vitamin D Receptor Signaling.
Bagnoud M, Remlinger J, Massy M, Lodygin D, Salmen A, Chan A, Lühder F, Hoepner R. Bagnoud M, et al. Cells. 2023 Sep 15;12(18):2291. doi: 10.3390/cells12182291. Cells. 2023. PMID: 37759513 Free PMC article.
References
- Yamamoto KR. Steroid receptor regulated transcription of specific genes and gene networks. Annu Rev Genet. 1985;19:209–252. - PubMed
- Beato M, Herrlich P, Schutz G. Steroid hormone receptors: Many actors in search of a plot. Cell. 1995;83:851–857. - PubMed
- Yudt MR, Cidlowski JA. The glucocorticoid receptor: Coding a diversity of proteins and responses through a single gene. Mol Endocrinol. 2002;16:1719–1726. - PubMed
- Karin M. New twists in gene regulation by glucocorticoid receptor: Is DNA binding dispensable? Cell. 1998;93:487–490. - PubMed
- McKay LI, Cidlowski JA. Molecular control of immune/inflammatory responses: Iinteractions between nuclear factor-kappa B and steroid receptor-signaling pathways. Endocr Rev. 1999;20:435–459. - PubMed
Publication types
MeSH terms
Substances
Grants and funding
- U01 DK056947/DK/NIDDK NIH HHS/United States
- DK49210/DK/NIDDK NIH HHS/United States
- DK56947/DK/NIDDK NIH HHS/United States
- R24 DK056947/DK/NIDDK NIH HHS/United States
- P01 DK049210/DK/NIDDK NIH HHS/United States
LinkOut - more resources
Full Text Sources
Other Literature Sources


