Anomalous diffusion of proteins due to molecular crowding - PubMed (original) (raw)
Anomalous diffusion of proteins due to molecular crowding
Daniel S Banks et al. Biophys J. 2005 Nov.
Abstract
We have studied the diffusion of tracer proteins in highly concentrated random-coil polymer and globular protein solutions imitating the crowded conditions encountered in cellular environments. Using fluorescence correlation spectroscopy, we measured the anomalous diffusion exponent alpha characterizing the dependence of the mean-square displacement of the tracer proteins on time, r(2)(t) approximately t(alpha). We observed that the diffusion of proteins in dextran solutions with concentrations up to 400 g/l is subdiffusive (alpha < 1) even at low obstacle concentration. The anomalous diffusion exponent alpha decreases continuously with increasing obstacle concentration and molecular weight, but does not depend on buffer ionic strength, and neither does it depend strongly on solution temperature. At very high random-coil polymer concentrations, alpha reaches a limit value of alpha(l) approximately 3/4, which we take to be the signature of a coupling between the motions of the tracer proteins and the segments of the dextran chains. A similar, although less pronounced, subdiffusive behavior is observed for the diffusion of streptavidin in concentrated globular protein solutions. These observations indicate that protein diffusion in the cell cytoplasm and nucleus should be anomalous as well, with consequences for measurements of solute diffusion coefficients in cells and for the modeling of cellular processes relying on diffusion.
Figures
FIGURE 1
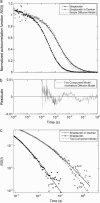
Normalized autocorrelation functions for streptavidin diffusing in PBS buffer with and without dextran obstacles (200 g/l of 276.5 kDa dextran). The fit of these autocorrelation functions using the anomalous diffusion model (Eq. 4) gives α = 0.99 ± 0.01 for no obstacles, and α = 0.76 ± 0.01 with obstacles (solid lines). The failure of the fit with the simple diffusion model (Eq. 4 with α = 1) for the case with obstacles is also shown (dashed line). The fit with the two-component model (Eq. 7) closely resembles the fit with the anomalous diffusion model and is not shown for clarity of the plot. (b) Residuals of the fits of the autocorrelation function in panel a for the case with dextran obstacles with both the anomalous diffusion model (dots, _χ_2 = 0.0024 for 459 data points from t = 0.5 _μ_s to 1 s, with three adjustable parameters) and the two-component model (solid line, _χ_2 = 0.0028 for the same data points with four adjustable parameters) are shown for the timescale relevant to diffusion. At shorter timescales, the two models are practically identical and the scatter in the data is large. (c) Asymptotic long-time behavior of the data and fits to the autocorrelation functions shown in panel a. For the case without dextran obstacles, the fit with the anomalous diffusion model shows a scaling (solid line). For the case with obstacles, the fit with the anomalous diffusion model shows a
scaling (solid line, α = 0.76), whereas the fit with the two-component model shows a
scaling (dashed line).
FIGURE 2
Effective distributions in average residence times calculated with the MEMFCS algorithm for the experimental autocorrelation data shown in Fig. 1 a (symbols), and for two sets of simulated autocorrelation data corresponding to the case of streptavidin diffusing in 200 g/l 276 kDa dextran. The first set was generated using the anomalous diffusion model and the parameters found from the fit of the experimental data (α = 0.76, _τ_D = 1.6 ms) and the second set was generated using the two-component model and the parameters found from the fit of the experimental data (_τ_D1 = 0.90 ms, _τ_D2 = 12 ms, relative amplitude _a_2/_a_1 = 0.41), as explained in the text. The peak values of the distributions found by the MEMFCS algorithm for the two-component model are 0.94 and 13 ms.
FIGURE 3
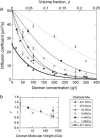
(a) Apparent diffusion coefficient, D(_τ_D), associated with the diffusion of streptavidin as a function of dextran concentration for dextrans of various average molecular weights (open and solid symbols). Also shown is D(_τ_D) for a 282 kDa dextran diffusing in a solution crowded by a 401.3 kDa dextran (half-solid symbols). Lines represent stretched exponential fits as explained in the text. Where necessary, some of the data points have been slightly shifted horizontally for clarity of the plot. (b) Value of the exponent ν as a function of the molecular weight of the polymers used as obstacle. The dotted line is a guide for the eyes.
FIGURE 4
(a) Anomalous diffusion exponent associated with the diffusion of streptavidin as a function of obstacle concentration for dextrans of various average molecular weights. Lines are fits to the data using Eq. 10 with _α_l = 0.74. Where necessary, some of the data points have been slightly shifted horizontally for clarity of the plots. (b) Crossover volume fraction _φ_0 found as a result of the fit shown in panel a for the different dextrans used as obstacles. The solid line shows the overlap volume fraction φ* calculated as explained in Materials and Methods.
FIGURE 5
Anomalous diffusion exponent corresponding to the diffusion of streptavidin in PBS with and without 200 g/l of 276 kDa dextran, as a function of added NaCl.
FIGURE 6
Anomalous diffusion exponent α associated with the diffusion of streptavidin in presence of 75 g/l and 200 g/l of 276 kDa dextran as a function of the temperature. The average values of the anomalous diffusion exponent α over the considered temperature range are shown: α = 0.86 ± 0.01 and 0.75 ± 0.01. The inset shows the corresponding variation of the apparent diffusion coefficient D(_τ_D) in _μ_m2/s, and the lines are fits assuming that the temperature dependence is only due to the change in the viscosity of water.
FIGURE 7
Anomalous diffusion exponent as a function of dextran concentration fitted to Eq. 10 for various tracers: EGFP and streptavidin in solutions crowded with the 276.5 kDa dextran, and fluorescein and 282 kDa FITC-dextran in solutions crowded with 401.3 kDa dextrans. Where necessary, some of the data points have been slightly shifted horizontally for clarity of the plots.
FIGURE 8
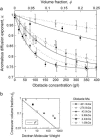
Anomalous diffusion exponents associated with the diffusion of streptavidin in solutions crowded with either BSA or nonfluorescent streptavidin for different concentrations of the obstacle proteins fitted to Eq. 10. For comparison, the exponent associated with diffusion in a solution crowded with a 4.44 kDa is also indicated.
Similar articles
- Meaningful interpretation of subdiffusive measurements in living cells (crowded environment) by fluorescence fluctuation microscopy.
Baumann G, Place RF, Földes-Papp Z. Baumann G, et al. Curr Pharm Biotechnol. 2010 Aug;11(5):527-43. doi: 10.2174/138920110791591454. Curr Pharm Biotechnol. 2010. PMID: 20553227 Free PMC article. - Macromolecular crowding: chemistry and physics meet biology (Ascona, Switzerland, 10-14 June 2012).
Foffi G, Pastore A, Piazza F, Temussi PA. Foffi G, et al. Phys Biol. 2013 Aug;10(4):040301. doi: 10.1088/1478-3975/10/4/040301. Epub 2013 Aug 2. Phys Biol. 2013. PMID: 23912807 - Multiple diffusion mechanisms due to nanostructuring in crowded environments.
Sanabria H, Kubota Y, Waxham MN. Sanabria H, et al. Biophys J. 2007 Jan 1;92(1):313-22. doi: 10.1529/biophysj.106.090498. Epub 2006 Oct 13. Biophys J. 2007. PMID: 17040979 Free PMC article. - Crowding effects on diffusion in solutions and cells.
Dix JA, Verkman AS. Dix JA, et al. Annu Rev Biophys. 2008;37:247-63. doi: 10.1146/annurev.biophys.37.032807.125824. Annu Rev Biophys. 2008. PMID: 18573081 Review. - Probing the interior of living cells with fluorescence correlation spectroscopy.
Weiss M. Weiss M. Ann N Y Acad Sci. 2008;1130:21-7. doi: 10.1196/annals.1430.002. Epub 2007 Dec 20. Ann N Y Acad Sci. 2008. PMID: 18096846 Review.
Cited by
- Entropy Production in a Fractal System with Diffusive Dynamics.
Zola RS, Lenzi EK, da Silva LR, Lenzi MK. Zola RS, et al. Entropy (Basel). 2023 Nov 23;25(12):1578. doi: 10.3390/e25121578. Entropy (Basel). 2023. PMID: 38136458 Free PMC article. - Macromolecular crowding effects on the kinetics of opposing reactions catalyzed by alcohol dehydrogenase.
Wilcox XE, Chung CB, Slade KM. Wilcox XE, et al. Biochem Biophys Rep. 2021 Feb 20;26:100956. doi: 10.1016/j.bbrep.2021.100956. eCollection 2021 Jul. Biochem Biophys Rep. 2021. PMID: 33665382 Free PMC article. - Short-Time Transport Properties of Bidisperse Suspensions of Immunoglobulins and Serum Albumins Consistent with a Colloid Physics Picture.
Beck C, Grimaldo M, Lopez H, Da Vela S, Sohmen B, Zhang F, Oettel M, Barrat JL, Roosen-Runge F, Schreiber F, Seydel T. Beck C, et al. J Phys Chem B. 2022 Sep 29;126(38):7400-7408. doi: 10.1021/acs.jpcb.2c02380. Epub 2022 Sep 16. J Phys Chem B. 2022. PMID: 36112146 Free PMC article. - Deciphering the intracellular forces shaping mitochondrial motion.
Fernández Casafuz AB, Brigante AMA, De Rossi MAC, Monastra AG, Bruno L. Fernández Casafuz AB, et al. Sci Rep. 2024 Oct 13;14(1):23914. doi: 10.1038/s41598-024-74734-5. Sci Rep. 2024. PMID: 39397143 Free PMC article. - Actin polymerization driven mitochondrial transport in mating S. cerevisiae.
Senning EN, Marcus AH. Senning EN, et al. Proc Natl Acad Sci U S A. 2010 Jan 12;107(2):721-5. doi: 10.1073/pnas.0908338107. Epub 2009 Dec 22. Proc Natl Acad Sci U S A. 2010. PMID: 20080741 Free PMC article.
References
- Pederson, T. 2000. Diffusional protein transport within the nucleus: a message in the medium. Nat. Cell Biol. 2:E73–E74. - PubMed
- Cluzel, P., M. Surette, and S. Leibler. 2000. An ultrasensitive bacterial motor revealed by monitoring signaling proteins in single cells. Science. 287:1652–1655. - PubMed
- Macnab, R. 2000. Action at a distance: bacterial flagellar assembly. Science. 290:2086–2087. - PubMed
Publication types
MeSH terms
Substances
LinkOut - more resources
Full Text Sources
Other Literature Sources


