Two rounds of whole genome duplication in the ancestral vertebrate - PubMed (original) (raw)
Two rounds of whole genome duplication in the ancestral vertebrate
Paramvir Dehal et al. PLoS Biol. 2005 Oct.
Abstract
The hypothesis that the relatively large and complex vertebrate genome was created by two ancient, whole genome duplications has been hotly debated, but remains unresolved. We reconstructed the evolutionary relationships of all gene families from the complete gene sets of a tunicate, fish, mouse, and human, and then determined when each gene duplicated relative to the evolutionary tree of the organisms. We confirmed the results of earlier studies that there remains little signal of these events in numbers of duplicated genes, gene tree topology, or the number of genes per multigene family. However, when we plotted the genomic map positions of only the subset of paralogous genes that were duplicated prior to the fish-tetrapod split, their global physical organization provides unmistakable evidence of two distinct genome duplication events early in vertebrate evolution indicated by clear patterns of four-way paralogous regions covering a large part of the human genome. Our results highlight the potential for these large-scale genomic events to have driven the evolutionary success of the vertebrate lineage.
Figures
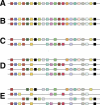
Figure 1. Pattern Predicted for the Relative Locations of Paralogous Genes from Two Genome Duplications
(A) Representation of a hypothetical genome that has 22 genes shown as colored squares. (B) A genome duplication generates a complete set of paralogs in identical order. (C) Many paralogous genes suffer disabling mutations, become pseudogenes, and are then lost. One could imagine this condition being evidence of a single round of genome duplication followed by significant gene losses. (D) A second genome duplication recreates another set of paralogs in identical order, with multigene families that retained two copies now present in four, and those that had lost a member now present in two copies. (E) Again, many paralogous genes suffer disabling mutations, become pseudogenes, and are then lost. Of course, unrelated gene duplications and transpositions can occur. Even though this leaves only a few four-member gene families, the patterns of 2- and 3-fold gene families unite, in various combinations, all four genomic segments, revealing that the sequential duplications had been of very large regions, in this case all or nearly all of this hypothetical genome.
Figure 2. Overview of the Building of a Gene Cluster and Phylogenetic Tree Shown by a Hypothetical Example
(A) Each circle represents a gene, labeled with the source genome according to the first letter of each taxon—C, M, H, and F for Ciona, mouse, human, and fugu, respectively—and further differentiated by numeral. BLASTP was first used to search all vertebrate genes for the one most similar to _Ciona'_s C1 gene, in this case the mouse gene M1. Then other genes are recruited to the cluster if they have a higher similarity score to M1 that that between C1 and M1, indicated here by the red lines. The six genes shown on the right side of the diagram have some sequence similarity to those in the cluster, but less than that between C1 and M1, so are not included. Because the vertebrates are more closely related to each other than any is to Ciona, each cluster will include those genes descended from a single gene in the common chordate ancestor, having arisen by either lineage splitting or gene duplication specific to one or more vertebrates. (See Materials and Methods for more details.) (B) Evolutionary tree of the genes in this cluster show separate duplications for fugu and for human. Because the maximum likelihood method does not rely solely on sequence similarity, there is no significance to the mouse gene being most similar to C1. The mouse genome simply contained the most slowly evolving vertebrate gene in this multigene family; this can be from any vertebrate taxon with approximately equal likelihood.
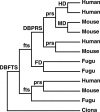
Figure 3. Hypothetical Phylogenetic Tree Showing All Possible Types of Gene Relationships and How They Are Most Parsimoniously Interpreted
Interior nodes are designated in lower case for those that simply result from lineage splitting and in upper case for gene duplications within a lineage. Although not shown, nodes are still scored if there is gene loss. Phylogenetic trees for each gene family can be viewed at
, also providing a valuable tool for improving the inference of gene function. DBFTS, duplication before fish–tetrapod split; DBPRS, duplication before primate–rodent split; FD, fugu duplication; fts, fish–tetrapod split; HD, human duplication; MD, mouse duplication; prs, primate–rodent split.
Figure 4. Phylogenetic Analysis of the Four Chordates with Drosophila as an Outgroup
This phylogenetic tree is based on 766 concatenated single copy protein sequences totaling 313,797 amino acid positions with branches proportional to the amount of change. Numerals in bold above the branches indicate the number of gene duplications occurring in each lineage; numerals below indicate branch lengths.
Figure 5. Plot of the Genomic Positions of Paralogous Pairs of Human Genes that Arose from Duplications Predating the Fish–Tetrapod Split
The queries shown here use Chromosomes 2, 4, 5, and 10, as indicated for the four panels. (The complete set can be seen in Figure S2.) On the _x-_axis is each chromosome arranged from p to q telomeres. On the _y-_axis is each of the 22 human autosomes plus the X and Y chromosomes. For each query gene on the _x-_axis, a “hit” is scored if the subject chromosome contains a paralog generated by a gene duplication prior to the fish–tetrapod split. The lower portion of each panel plots the _n-_fold redundancy along the query chromosome as defined by pairs of paralogs detected in a sliding window analysis. See the Material and Methods section for details, but briefly, for every human query gene, a window was considered of 50 genes to the left and 50 genes to the right, with a “hit” obtained for the subject chromosome if it includes the early-duplicated paralogs of genes on each side of the query. Four-fold (i.e., including the query) matching, as expected by the 2R hypothesis, is highlighted in a darker shade of blue.
Figure 6. Histogram Showing the Lower Bound Estimate of _N-_fold Redundancy Using the Analysis Reported in Figure 5
This histogram is generated by counting the depth of paralogon redundancy across all human chromosomes as shown in the lower part of Figure S2 (and subsampled for Figure 5). The peak at 4-fold coverage is consistent with the 2R hypothesis, and constitutes a lower bound estimate, because the sliding window examines only a small span of flanking genes and would be highly subject to effects of local gene rearrangements.
Figure 7. An Arbitrarily Selected Subset of the Human Genome Showing the Physical Relationships Among Paralogous Genes
(A) This is an example of the tetra-paralogous relationships of a subset of human genes that are all inferred, by gene trees, to have duplicated prior to the split of fish from tetrapods, but after the split of Ciona from vertebrates. These genes are on four chromosomes with their identities indicated outside of the circle. The complete set of tetra-paralogons can be viewed in Figure S3. (B) In contrast, paralogous human genes generated by duplications after the split of fish and tetrapods, as shown for this sample of the same four human chromosomes, do not form such tetra-paralogons. Their pattern appears to result from smaller-scale tandem duplications of individual genes or segments, followed by slow rearrangements. In addition to these apparently functional gene pairs shown in the figure for this portion of the human genome, we have identified eight pseudogene pairs that occur on different chromosomes; it is not clear whether these pseudogenes are the result of random retrotransposition (or other rearrangement mechanisms) rather than gene conversion events between older duplicates, which would make it appear as though these had duplicated later than they actually did, as has been observed in yeast [29].
Similar articles
- Conserved synteny between the Ciona genome and human paralogons identifies large duplication events in the molecular evolution of the insulin-relaxin gene family.
Olinski RP, Lundin LG, Hallböök F. Olinski RP, et al. Mol Biol Evol. 2006 Jan;23(1):10-22. doi: 10.1093/molbev/msj002. Epub 2005 Aug 31. Mol Biol Evol. 2006. PMID: 16135778 - Phylogenetic analyses alone are insufficient to determine whether genome duplication(s) occurred during early vertebrate evolution.
Horton AC, Mahadevan NR, Ruvinsky I, Gibson-Brown JJ. Horton AC, et al. J Exp Zool B Mol Dev Evol. 2003 Oct 15;299(1):41-53. doi: 10.1002/jez.b.40. J Exp Zool B Mol Dev Evol. 2003. PMID: 14508816 - The endothelin system: evolution of vertebrate-specific ligand-receptor interactions by three rounds of genome duplication.
Braasch I, Volff JN, Schartl M. Braasch I, et al. Mol Biol Evol. 2009 Apr;26(4):783-99. doi: 10.1093/molbev/msp015. Epub 2009 Jan 27. Mol Biol Evol. 2009. PMID: 19174480 - Genome duplication and gene-family evolution: the case of three OXPHOS gene families.
De Grassi A, Lanave C, Saccone C. De Grassi A, et al. Gene. 2008 Sep 15;421(1-2):1-6. doi: 10.1016/j.gene.2008.05.011. Epub 2008 Jun 23. Gene. 2008. PMID: 18573316 Review. - Structural and functional evolution of gonadotropin-releasing hormone in vertebrates.
Okubo K, Nagahama Y. Okubo K, et al. Acta Physiol (Oxf). 2008 May;193(1):3-15. doi: 10.1111/j.1748-1716.2008.01832.x. Epub 2008 Feb 18. Acta Physiol (Oxf). 2008. PMID: 18284378 Review.
Cited by
- An ancient genomic regulatory block conserved across bilaterians and its dismantling in tetrapods by retrogene replacement.
Maeso I, Irimia M, Tena JJ, González-Pérez E, Tran D, Ravi V, Venkatesh B, Campuzano S, Gómez-Skarmeta JL, Garcia-Fernàndez J. Maeso I, et al. Genome Res. 2012 Apr;22(4):642-55. doi: 10.1101/gr.132233.111. Epub 2012 Jan 10. Genome Res. 2012. PMID: 22234889 Free PMC article. - LGI Proteins and Epilepsy in Human and Animals.
Pakozdy A, Patzl M, Zimmermann L, Jokinen TS, Glantschnigg U, Kelemen A, Hasegawa D. Pakozdy A, et al. J Vet Intern Med. 2015 Jul-Aug;29(4):997-1005. doi: 10.1111/jvim.12610. Epub 2015 Jun 1. J Vet Intern Med. 2015. PMID: 26032921 Free PMC article. Review. - Three Distinct Glutamate Decarboxylase Genes in Vertebrates.
Grone BP, Maruska KP. Grone BP, et al. Sci Rep. 2016 Jul 27;6:30507. doi: 10.1038/srep30507. Sci Rep. 2016. PMID: 27461130 Free PMC article. - Evolutionary and Topological Properties of Genes and Community Structures in Human Gene Regulatory Networks.
Szedlak A, Smith N, Liu L, Paternostro G, Piermarocchi C. Szedlak A, et al. PLoS Comput Biol. 2016 Jun 30;12(6):e1005009. doi: 10.1371/journal.pcbi.1005009. eCollection 2016 Jun. PLoS Comput Biol. 2016. PMID: 27359334 Free PMC article. - The sea lamprey meiotic map improves resolution of ancient vertebrate genome duplications.
Smith JJ, Keinath MC. Smith JJ, et al. Genome Res. 2015 Aug;25(8):1081-90. doi: 10.1101/gr.184135.114. Epub 2015 Jun 5. Genome Res. 2015. PMID: 26048246 Free PMC article.
References
- Ohno S. Evolution by gene duplication. Berlin: Springer-Verlag; 1970. 160 pp.
- Lander ES, Linton LM, Birren B, Nusbaum C, Zody MC, et al. Initial sequencing and analysis of the human genome. Nature. 2001;409:860–921. - PubMed
- Venter JC, Adams MD, Myers EW, Li PW, Mural RJ, et al. The sequence of the human genome. Science. 2001;291:1304–1351. - PubMed
- Lundin LG. Evolution of the vertebrate genome as reflected in paralogous chromosomal regions in man and the house mouse. Genomics. 1993;16:1–19. - PubMed
- Meyer A, Schartl M. Gene and genome duplications in vertebrates: the one-to-four (-to-eight in fish) rule and the evolution of novel gene functions. Curr Opin Cell Biol. 1999;11:699–704. - PubMed
Publication types
MeSH terms
LinkOut - more resources
Full Text Sources
Other Literature Sources


