Type I interferons act directly on CD8 T cells to allow clonal expansion and memory formation in response to viral infection - PubMed (original) (raw)
Comparative Study
. 2005 Sep 5;202(5):637-50.
doi: 10.1084/jem.20050821. Epub 2005 Aug 29.
Affiliations
- PMID: 16129706
- PMCID: PMC2212878
- DOI: 10.1084/jem.20050821
Comparative Study
Type I interferons act directly on CD8 T cells to allow clonal expansion and memory formation in response to viral infection
Ganesh A Kolumam et al. J Exp Med. 2005.
Abstract
T cell expansion and memory formation are generally more effective when elicited by live organisms than by inactivated vaccines. Elucidation of the underlying mechanisms is important for vaccination and therapeutic strategies. We show that the massive expansion of antigen-specific CD8 T cells that occurs in response to viral infection is critically dependent on the direct action of type I interferons (IFN-Is) on CD8 T cells. By examining the response to infection with lymphocytic choriomeningitis virus using IFN-I receptor-deficient (IFN-IR(0)) and -sufficient CD8 T cells adoptively transferred into normal IFN-IR wild-type hosts, we show that the lack of direct CD8 T cell contact with IFN-I causes >99% reduction in their capacity to expand and generate memory cells. The diminished expansion of IFN-IR(0) CD8 T cells was not caused by a defect in proliferation but by poor survival during the antigen-driven proliferation phase. Thus, IFN-IR signaling in CD8 T cells is critical for the generation of effector and memory cells in response to viral infection.
Figures
Figure 1.
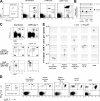
IFN-IR0 P14 CD8 T cells respond normally in vitro. (A) Phenotypic analysis of spleen cells derived from WT P14 TCR transgenic mice and IFN-IR0 P14 TCR transgenic mice. Numbers represent the percentage of cells in the indicated quadrant. (B) Spleen cells derived from WT and IFN-IR0 P14 TCR transgenic mice were cultured in vitro for 5 h either in the absence or presence of GP33-41 peptide and stained for cytokines. Data are gated on CD8 T cells. Numbers represent the percentage of cells in the indicated quadrant. (C) CFSE-labeled WT and IFN-IR0 P14 spleen cells cultured for 3 d with (bottom) and without (top) peptide stimulus. Data are gated on CD8 T cells.
Figure 2.
Action of IFN-I on virus-specific CD8 T cells is critical for their clonal expansion. (A) 20,000 purified WT (Ly5.2) or IFN-IR0 (Ly 5.2) P14 CD8 T cells were transferred into individual C57BL/6 (Ly5.1) mice that were infected with LCMV strain Armstrong the next day. Donor cells were analyzed on gated CD8+ cells. Data are representative of at least five mice at each time point from three separate experiments. Numbers represent the percentage of cells in the indicated quadrant. (B) Number of donor cells recovered per spleen on different days after infection. Each point represents the mean ± SD of at least five mice pooled from three experiments. The level of detection was 104 cells/spleen.
Figure 3.
IFN-I–unresponsive CD8 T cells exhibit highly diminished expansion compared with IFN-I–responsive CD8 T cells of identical specificity in the same infected host. 60,000 each of WT (Thy1.2, Ly5.1) plus IFN-IR0 (Thy1.2, Ly5.2) P14 CD8 T cells were cotransferred into a congenic host (Thy1.1, B6 Ly5.2) and infected with LCMV the next day. Donor cells were analyzed on gated CD8+ cells in the spleen (A) and in other compartments (B) on day 8 after infection. Data are representative of two experiments with four mice in each experiment. Numbers represent the percentage of cells in the indicated quadrant.
Figure 4.
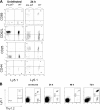
IFN-I action on virus-specific CD8 T cells affects granzyme B expression but not cytokine effector functions. (A) Spleen cells from the mice indicated in Fig. 3 were stimulated in vitro for 5 h with LCMV GP33-41 peptide in the presence of brefeldin A. IFN-γ or TNF-α production was determined by intracellular cytokine staining in gated donor (Thy1.2+ CD8+) T cells. Ly5.2+ cells are IFN-IR0. Ly5.2− cells were confirmed to be WT donors by positive Ly5.1 staining done separately. Numbers represent the percentage of cells in the indicated quadrant. (B) Granzyme B staining was done ex vivo. These experiments were repeated at least three times with similar results. Numbers represent the percentage of cells in the indicated quadrant. (C) Mean values of percent donor cells expressing granzyme B in three different experiments comprising 11 mice at day 8 and 9 mice at day 6 after infection. Values shown are the mean ± SD.
Figure 5.
IFN-I–unresponsive effector CD8 T cells, although generated in low numbers, differentiate into memory cells that maintain stably thereafter. (A) 20,000 purified WT (Ly5.2) or IFN-IR0 (Ly 5.2) P14 CD8 T cells were transferred into individual C57BL/6 (Ly5.1) mice that were infected with LCMV the next day. The number of donor cells recovered per spleen on different days after infection was calculated by Ly 5.2 and tetramer staining. The level of detection was <104 cells/spleen. Each point represents an individual mouse. The average recovery of WT donor CD8 T cells was 1.10 ± 0.07 × 10⁷ and 0.92 ± 0.2 × 10⁶ at days 8 and 15, respectively, whereas the recovery of IFN-IR0 donor cells was 3.20 ± 0.4 × 10⁴ and 1.70 ± 0.31 × 10⁴ at days 8 and 15, respectively. (B) Spleen cells from 200 d after LCMV infection were stimulated in vitro for 5 h with LCMV GP33-41 peptide in the presence of brefeldin A. IFN-γ or TNF-α production was determined by intracellular cytokine staining, and the data are presented on gated CD8+ T cells. Numbers represent the percentage of cells in the indicated quadrant. Ly5.2−, recipient CD8 T cells; Ly5.2+, donor WT or IFN-IR0 P14 CD8 T cells.
Figure 6.
Adoptively transferred WT and IFN-IR0 P14 CD8 T cells were maintained at an equal ratio either in naive or in LCMV immune hosts. 0.8 × 10⁶ each of WT (Thy1.2, Ly5.1) and IFN-IR0 (Thy1.2, Ly5.2) P14 CD8 T cells were transferred into (A) naive B6 Thy1.1 mice or into (B) LCMV-immune Thy1.1 mice that had previously received equal numbers of WT plus IFN-IR0 CD8 T cells before LCMV infection. WT/IFN-IR0 donor CD8 T cell ratios were analyzed at days 1 and 8 after transfer. The donor cells were identified based on positive staining for Thy1.2 as well as CFSE (R1 gate). In B, freshly transferred Thy1.2 donor CD8 T cells were distinguished (R1 gate) from previously primed Thy1.2 memory CD8 cells (R2 gate) based on the CFSE label. The numbers in parenthesis indicate the average recovery of donor cells per spleen (n = 3) in each group. Numbers represent the percentage of cells in the indicated quadrant.
Figure 7.
The difference in the expansion of WT and IFN-IR0 CD8 T cells in response to viral infection was observed in IFN-IR0 and heterozygous hosts. 35,000 each of WT (Ly5.1) and IFN-IR0 P14 CD8 T cells (Ly5.2) were cotransferred into littermate IFN-R+/+, IFN-IR+/−, or IFN-IR−/− hosts (Ly5.2) and assessed for their expansion in response to LCMV infection. (A) The ratio of WT/IFN-IR0 P14 donor CD8 T cells was analyzed by gating on MHC tetramer–positive CD8 T cells and assessing Ly5.1 staining among V β8 TCR-positive cells (P14 CD8 T cells express V β8 TCR). The average recovery of IFN-R+/− and IFN-IR−/− P14 donor CD8 T cells per spleen is indicated in parenthesis (n = 3 per group). (B) Spleen viral titers at different times after infection. Each dot represents an individual mouse. IFN-IR expression heterozygosity was confirmed by PCR.
Figure 8.
IFN-I action on a variety of CD8 T cell clonal specificities is required for their expansion in response to viral infection, cross priming, and vaccination in the presence of adjuvants that mimic viral infection–induced cytokine profiles. (A) 1.3 ×10⁶ each of WT (Thy1.2, Ly5.1) and IFN-IR0 (Thy 1.2, Ly5.2) OT-1 CD8 T cells were transferred into C57BL/6 Thy1.1 mice. The mice were analyzed the next day (No infection), 5 d after LCMV infection alone (LCMV only), or 5 d after LCMV + ovalbumin immunization (LCMV + Ova). Data are gated on CD8 T cells. Numbers inside the box indicate the average ratio of IFN-IR0 (Thy1.2+ Ly5.1low) to WT (Thy1.2+ Ly5.1+) OT-1 CD8 T cells (n = 5 per group combined from two experiments). Similar trends were seen in a different experiment in which 4 × 10⁶ each of the donor cells were transferred. (B) Average recovery of WT and IFN-IR0 OT-1 donor CD8 T cells per spleen in the experiments indicated in A. Values shown are the mean ± SD. (C) 3.4 × 10⁶ each of enriched polyclonal CD8 T cells derived from age-matched C57BL/6 WT (Thy1.2, Ly5.1) and IFN-IR0 (Thy1.2, Ly5.2) mice were transferred into C57BL/6 Thy1.1 recipients and then infected with LCMV the next day. Mice were analyzed on day 5 after infection (day 6 after cell transfer in the case of uninfected recipients). Similar trends were observed in a different experiment in which mice were analyzed on day 6 after infection. (D) 500,000 each of WT (Thy1.2, Ly5.1) and IFN-IR0 (Thy1.2, Ly5.2) P14 CD8 T cells were transferred into B6 Thy1.1 hosts and left untreated, immunized with 25 μg GP33-41 peptide mixed with low (105 units) or high (106 units) dose universal IFN-I (IFN-α), immunized with peptide + 1 μg recombinant IL-12, or infected with LCMV. Dot plots show the average ratio of the IFN-IR0 versus WT donor P14 cells among the gated donor CD8 T cell population. (E) Recovery of IFN-IR0 and WT donor P14 CD8 T cells per spleen in the experiment described in D. Each point represents an individual mouse.
Figure 9.
IFN-IR0 CD8 T cells undergo activation and survive in the early phase of infection. 106 each of WT (Thy1.2, Ly5.1) and IFN-IR0 (Thy1.2, Ly5.2) P14 CD8 T cells were cotransferred into WT (Thy1.1, Ly5.2) mice that were infected with LCMV. (A) Both WT and IFN-IR0 cells underwent activation in response to infection within 24 h as seen by activation markers. Data are gated on donor CD8 T cell populations. Ly5.1+ events are WT, and Ly5.1− events are IFN-IR0 donors. (B) Ratio of WT/IFN-IR0 donors P14 CD8 T cells at various times after infection.
Figure 10.
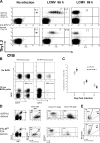
IFN-IR0 CD8 T cells were not defective in proliferation but survived poorly. (A) 400,000 each of purified, CFSE-labeled WT P14 or IFN-IR0 P14 naive CD8 T cells (Thy1.2, Ly5.2) were transferred into congenic naive C57BL/6 (Thy1.1) mice and left uninfected or infected the next day. Gated CD8+ T cells from the spleen were analyzed at 66 or 86 h after infection for division and frequencies of donor Thy1.2+ cells. Data are representative of five mice that received WT cells and seven mice that received IFN-IR0 donors at each time point in two individual experiments. Note that the IFN-IR0 P14 CD8 T cells proliferate but exhibit diminished accumulation. Numbers represent the percentage of cells in the indicated quadrant. (B) IFN-IR0 CD8 T cells continue to proliferate at later times. 400,000 cells each of purified WT P14 naive CD8 T cell (Ly5.2) or IFN-IR0 P14 naive CD8 T cell (Ly5.2) donors were transferred into congenic naive C57BL/6 (Ly5.1) mice. Mice were infected with LCMV the next day and were injected with 0.2 mg BrdU i.p on day 5 after infection. Gated CD8+ spleen cells were analyzed for BrdU incorporation in donor (Ly5.2+) and endogenous (Ly5.2−) CD8 T cells 12 h after BrdU injection. Numbers indicate the percentage of BrdU-positive cells among the donor Ly5.2+ cells. Data are representative of two experiments and a total of four mice in each group. (C) The BrdU pulse was done at days 3, 5, and 7 after infection, and mice were analyzed at 12 h after BrdU injection. Data are pooled from five experiments. Values shown are the mean ± SD. (D) CFSE-labeled donor P14 CD8 cells from LCMV-infected mice indicated in the panels were analyzed after 66 h for scatter property and ex vivo annexin V staining (representative of four mice in each group). (E) Spleen cells at day 5 after infection were cultured in vitro for 24 h without peptide stimulation or cytokines. After 24 h, gated WT or IFN-IR0 donor P14 CD8 T cells were analyzed for scatter properties. Data are an example of two mice per group in one experiment and one mouse per group in a different experiment.
Similar articles
- Signal 3 requirement for memory CD8+ T-cell activation is determined by the infectious pathogen.
Keppler SJ, Aichele P. Keppler SJ, et al. Eur J Immunol. 2011 Nov;41(11):3176-86. doi: 10.1002/eji.201141537. Epub 2011 Sep 26. Eur J Immunol. 2011. PMID: 21830209 - Type-I IFN drives the differentiation of short-lived effector CD8+ T cells in vivo.
Wiesel M, Crouse J, Bedenikovic G, Sutherland A, Joller N, Oxenius A. Wiesel M, et al. Eur J Immunol. 2012 Feb;42(2):320-9. doi: 10.1002/eji.201142091. Epub 2011 Dec 20. Eur J Immunol. 2012. PMID: 22102057 - Innate inflammatory signals induced by various pathogens differentially dictate the IFN-I dependence of CD8 T cells for clonal expansion and memory formation.
Thompson LJ, Kolumam GA, Thomas S, Murali-Krishna K. Thompson LJ, et al. J Immunol. 2006 Aug 1;177(3):1746-54. doi: 10.4049/jimmunol.177.3.1746. J Immunol. 2006. PMID: 16849484 - T-cell turnover in vivo and the role of cytokines.
Sprent J, Zhang X, Sun S, Tough D. Sprent J, et al. Immunol Lett. 1999 Jan;65(1-2):21-5. doi: 10.1016/s0165-2478(98)00119-9. Immunol Lett. 1999. PMID: 10065622 Review. - Bystander stimulation of T cells in vivo by cytokines.
Tough DF, Sprent J. Tough DF, et al. Vet Immunol Immunopathol. 1998 May 15;63(1-2):123-9. doi: 10.1016/s0165-2427(98)00088-9. Vet Immunol Immunopathol. 1998. PMID: 9656447 Review.
Cited by
- Interaction between unrelated viruses during in vivo co-infection to limit pathology and immunity.
McAfee MS, Huynh TP, Johnson JL, Jacobs BL, Blattman JN. McAfee MS, et al. Virology. 2015 Oct;484:153-162. doi: 10.1016/j.virol.2015.05.021. Epub 2015 Jun 20. Virology. 2015. PMID: 26099694 Free PMC article. - The RIG-I-like receptor LGP2 controls CD8(+) T cell survival and fitness.
Suthar MS, Ramos HJ, Brassil MM, Netland J, Chappell CP, Blahnik G, McMillan A, Diamond MS, Clark EA, Bevan MJ, Gale M Jr. Suthar MS, et al. Immunity. 2012 Aug 24;37(2):235-48. doi: 10.1016/j.immuni.2012.07.004. Epub 2012 Jul 26. Immunity. 2012. PMID: 22841161 Free PMC article. - T cell responses to COVID-19 infection and vaccination in patients with multiple sclerosis receiving disease-modifying therapy.
Reder AT, Stuve O, Tankou SK, Leist TP. Reder AT, et al. Mult Scler. 2023 May;29(6):648-656. doi: 10.1177/13524585221134216. Epub 2022 Nov 28. Mult Scler. 2023. PMID: 36440826 Free PMC article. Review. - The Role of Type I IFNs in Influenza: Antiviral Superheroes or Immunopathogenic Villains?
Wu W, Metcalf JP. Wu W, et al. J Innate Immun. 2020;12(6):437-447. doi: 10.1159/000508379. Epub 2020 Jun 19. J Innate Immun. 2020. PMID: 32564033 Free PMC article. Review. - Role of interferon regulatory factor 7 in T cell responses during acute lymphocytic choriomeningitis virus infection.
Zhou S, Cerny AM, Fitzgerald KA, Kurt-Jones EA, Finberg RW. Zhou S, et al. J Virol. 2012 Oct;86(20):11254-65. doi: 10.1128/JVI.00576-12. Epub 2012 Aug 8. J Virol. 2012. PMID: 22875973 Free PMC article.
References
- Murali-Krishna, K., J.D. Altman, M. Suresh, D.J. Sourdive, A.J. Zajac, J. Miller, J. Slansky, and R. Ahmed. 1998. Counting antigen-specific CD8 T cells: a reevaluation of bystander activation during viral infection. Immunity. 8:177–187. - PubMed
- Kaech, S.M., E.J. Wherry, and R. Ahmed. 2002. Effector and memory T-cell differentiation: implications for vaccine development. Nat. Rev. Immunol. 2:251–262. - PubMed
- Hochrein, H., K. Shortman, D. Vremec, B. Scott, P. Hertzog, and M. O'Keeffe. 2001. Differential production of IL-12, IFN-α, and IFN-γ by mouse dendritic cell subsets. J. Immunol. 166:5448–5456. - PubMed
- Stark, G.R., I.M. Kerr, B.R. Williams, R.H. Silverman, and R.D. Schreiber. 1998. How cells respond to interferons. Annu. Rev. Biochem. 67:227–264. - PubMed
Publication types
MeSH terms
Substances
LinkOut - more resources
Full Text Sources
Other Literature Sources
Molecular Biology Databases
Research Materials


