Monitoring the mode and tempo of concerted evolution in the Drosophila melanogaster rDNA locus - PubMed (original) (raw)
Comparative Study
Monitoring the mode and tempo of concerted evolution in the Drosophila melanogaster rDNA locus
Karin Tetzlaff Averbeck et al. Genetics. 2005 Dec.
Abstract
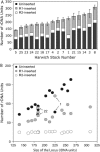
Non-LTR retrotransposons R1 and R2 have persisted in rRNA gene loci (rDNA) since the origin of arthropods despite their continued elimination by the recombinational mechanisms of concerted evolution. This study evaluated the short-term evolutionary dynamics of the rDNA locus by measuring the divergence among replicate Drosophila melanogaster lines after 400 generations. The total number of rDNA units on the X chromosome of each line varied from 140 to 310, while the fraction of units inserted with R1 and R2 retrotransposons ranged from 37 to 65%. This level of variation is comparable to that found in natural population surveys. Variation in locus size and retrotransposon load was correlated with large changes in the number of uninserted and R1-inserted units, yet the numbers of R2-inserted units were relatively unchanged. Intergenic spacer (IGS) region length variants were also used to evaluate changes in the rDNA loci. All IGS length variants present in the lines showed significant increases and decreases of copy number. These studies, combined with previous data following specific R1 and R2 insertions in these lines, help to define the type and distribution, both within the locus and within the individual units, of recombinational events that give rise to the concerted evolution of the rDNA locus.
Figures
Figure 1.
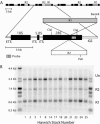
Retrotransposable element insertions in the rRNA gene (rDNA) loci of D. melanogaster. (A) The tandemly repeated rDNA units (top) are shown with no insertion, an R1 element, an R2 element, or both R1 and R2 elements in the 28S gene. An expanded diagram of an rDNA unit includes both full-length R1 and R2 insertions. Solid bars represent the 18S, 5.8S, and 28S rRNA genes, and thin open bars represent the ETS, internal transcribed spacers (ITS), and IGS. The locations of restriction enzyme cleavage sites and the probe used in B are indicated. (B) A sample Southern blot used to determine the fraction of inserted and uninserted rDNA units in the Harwich lines. Genomic DNA from females of each line was digested with _Bam_HI, _Cla_I, and _Pst_I, fractioned through a 1% agarose gel, and transferred to nitrocellulose. The resulting blot was probed with the 28S gene segment indicated in A. Uninserted rDNA units were represented by a 2.2-kb _Cla_I-_Cla_I fragment, R1-inserted and doubly inserted units by a 0.6-kb _Bam_HI-_Cla_I fragment, and R2-inserted units by a 1.4-kb _Pst_I-_Cla_I fragment. DNA markers were run in the first and last lanes with the fragment sizes indicated on the left.
Figure 2.
Variation in X chromosome rDNA locus size and load of R1 and R2 elements in 16 Harwich replicate lines. (A) The total number of rDNA units in each line is indicated by the total height of each bar. The numbers of uninserted, R1-inserted, and R2-inserted units are indicated by the shading. The total number of rDNA units in each line was determined by counting all R2 elements via a series of PCR reactions and dividing that number by the fraction of the total rDNA units containing R2 insertions (Table 1). Five R2 elements in each line were inserted upstream of an R1 and, thus, were not scored as R2 inserted by the Southern assay approach in Figure 1B. On the basis of the total number of units, the numbers of uninserted and R1-inserted units were also calculated. (B) The numbers of uninserted, R1-inserted, and R2-inserted units for each line are plotted relative to total locus size.
Figure 3.
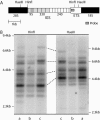
IGS length profiles reproduced with two different restriction enzymes. (A) A diagram of the IGS region showing restriction sites and probe location. The IGS is mostly composed of tandem repeats of 95, 330, and 240 bp. (B) Genomic DNA was digested with _Hin_fI or _Hae_III, fractioned through a 1% agarose gel, and transferred to nitrocellulose. The resulting Southern blot was probed with a region of the ETS, marked with a shaded bar in A. The position of DNA standards in kilobases is indicated on the left and right. Lanes labeled a contain DNA from Harwich line 3, lanes labeled b contain DNA from line 20, and lanes labeled c contain DNA from line 2. Several corresponding bands in these last two lanes are connected with lines. The pattern of IGS bands is identical between the _Hin_fI digests and _Hae_III digests, with _Hin_fI producing smaller fragments that are better separated on the gel.
Figure 4.
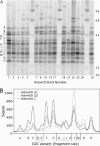
IGS profiles of all Harwich lines. (A) Genomic DNA was digested with _Hin_fI, fractionated through 1% agarose gel, transferred to a nitrocellulose filter, and hybridized with the ETS probe (see Figure 3A). The blot reveals a similar set of length variants present in all Harwich lines but significant differences in the abundance of each variant. Predominant bands have been labeled with letters A–O. (B) Signal tracings of three Harwich lines from a phosphorimage of the probed filter show that the relative intensities of the variant bands are significantly different across the lines.
Figure 5.
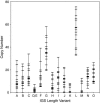
Range of copy number for each IGS length variant. Variants are labeled A–O and correspond to the bands shown in Figure 4. Copy number for each IGS variant was calculated for each Harwich line from the fraction of hybridization signal quantitated per band multiplied by the total number of units in the locus. For all IGS variants, a set of horizontal hatch marks indicates the copy numbers determined for the 16 Harwich lines. Lines that have the same copy number for a particular variant (e.g., 0 copies) are represented by a single hatch mark. Vertical lines represent the range of copy numbers observed.
Figure 6.
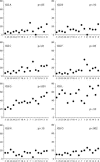
Copy number for eight major IGS variants arranged by rDNA locus size from smallest to largest. Across the lines, the copy number of variants is positively correlated with the size of the rDNA locus, but the strength of the correlation (_P_-values are shown) varies from very strong (G and O) to weak (L and N).
Similar articles
- Rates of R1 and R2 retrotransposition and elimination from the rDNA locus of Drosophila melanogaster.
Pérez-González CE, Eickbush TH. Pérez-González CE, et al. Genetics. 2002 Oct;162(2):799-811. doi: 10.1093/genetics/162.2.799. Genetics. 2002. PMID: 12399390 Free PMC article. - Dynamics of R1 and R2 elements in the rDNA locus of Drosophila simulans.
Pérez-González CE, Eickbush TH. Pérez-González CE, et al. Genetics. 2001 Aug;158(4):1557-67. doi: 10.1093/genetics/158.4.1557. Genetics. 2001. PMID: 11514447 Free PMC article. - R1 and R2 retrotransposition and deletion in the rDNA loci on the X and Y chromosomes of Drosophila melanogaster.
Pérez-González CE, Burke WD, Eickbush TH. Pérez-González CE, et al. Genetics. 2003 Oct;165(2):675-85. doi: 10.1093/genetics/165.2.675. Genetics. 2003. PMID: 14573479 Free PMC article. - Evolution of R1 and R2 in the rDNA units of the genus Drosophila.
Eickbush TH, Burke WD, Eickbush DG, Lathe WC 3rd. Eickbush TH, et al. Genetica. 1997;100(1-3):49-61. Genetica. 1997. PMID: 9440258 Review. - Integration, Regulation, and Long-Term Stability of R2 Retrotransposons.
Eickbush TH, Eickbush DG. Eickbush TH, et al. Microbiol Spectr. 2015 Apr;3(2):MDNA3-0011-2014. doi: 10.1128/microbiolspec.MDNA3-0011-2014. Microbiol Spectr. 2015. PMID: 26104703 Free PMC article. Review.
Cited by
- Varying strength of selection contributes to the intragenomic diversity of rRNA genes.
Sultanov D, Hochwagen A. Sultanov D, et al. Nat Commun. 2022 Nov 25;13(1):7245. doi: 10.1038/s41467-022-34989-w. Nat Commun. 2022. PMID: 36434003 Free PMC article. - Under the magnifying glass: The ups and downs of rDNA copy number.
Kindelay SM, Maggert KA. Kindelay SM, et al. Semin Cell Dev Biol. 2023 Feb 28;136:38-48. doi: 10.1016/j.semcdb.2022.05.006. Epub 2022 May 18. Semin Cell Dev Biol. 2023. PMID: 35595601 Free PMC article. Review. - Transcribed sex-specific markers on the Y chromosome of the oriental fruit fly, Bactrocera dorsalis.
Carraretto D, Aketarawong N, Di Cosimo A, Manni M, Scolari F, Valerio F, Malacrida AR, Gomulski LM, Gasperi G. Carraretto D, et al. BMC Genet. 2020 Dec 18;21(Suppl 2):125. doi: 10.1186/s12863-020-00938-z. BMC Genet. 2020. PMID: 33339494 Free PMC article. - The peculiar genetics of the ribosomal DNA blurs the boundaries of transgenerational epigenetic inheritance.
Bughio F, Maggert KA. Bughio F, et al. Chromosome Res. 2019 Mar;27(1-2):19-30. doi: 10.1007/s10577-018-9591-2. Epub 2018 Dec 4. Chromosome Res. 2019. PMID: 30511202 Free PMC article. Review. - Genomic Copy-Number Loss Is Rescued by Self-Limiting Production of DNA Circles.
Mansisidor A, Molinar T Jr, Srivastava P, Dartis DD, Pino Delgado A, Blitzblau HG, Klein H, Hochwagen A. Mansisidor A, et al. Mol Cell. 2018 Nov 1;72(3):583-593.e4. doi: 10.1016/j.molcel.2018.08.036. Epub 2018 Oct 4. Mol Cell. 2018. PMID: 30293780 Free PMC article.
References
- Burke, W. D., H. S. Malik, W. C. Lathe III and T. H. Eickbush, 1998. Are retrotransposons long-term hitchhikers? Nature 392: 141–142. - PubMed
- Burke, W. D., D. Singh and T. H. Eickbush, 2003. R5 retrotransposons insert into a family of infrequently transcribed 28S rRNA genes of Planaria. Mol. Biol. Evol. 20: 1260–1270. - PubMed
- Coen, E. S., J. M. Thoday and G. Dover, 1982. Rate of turnover of structural variants in the rDNA gene family of Drosophila melanogaster. Nature 295: 564–568. - PubMed
- Dover, G., 1994. Concerted evolution, molecular drive and natural selection. Curr. Biol. 4: 1165–1166. - PubMed
- Eickbush, T. H., 2002. R2 and related site-specific non-long terminal repeat retrotransposons, pp. 813–835 in Mobile DNA II, edited by N. L. Craig, R. Craigie, M. Gellart and A. M. Lambowitz. American Society for Microbiology, Washington, DC.
Publication types
MeSH terms
Substances
LinkOut - more resources
Full Text Sources
Molecular Biology Databases
