Neurogenesis and neuroprotection induced by peripheral immunomodulatory treatment of experimental autoimmune encephalomyelitis - PubMed (original) (raw)
Neurogenesis and neuroprotection induced by peripheral immunomodulatory treatment of experimental autoimmune encephalomyelitis
Rina Aharoni et al. J Neurosci. 2005.
Abstract
Brain insults such as the autoimmune inflammatory process in multiple sclerosis (MS) and experimental autoimmune encephalomyelitis (EAE) induce a measure of neurogenesis, but its regenerative therapeutic consequence is limited, because it fails to regenerate functional neurons and compensate the damage. Here, we investigated whether peripheral immunomodulatory treatment for MS/EAE, glatiramer acetate (GA), can enhance neurogenesis and generate neuroprotection in the CNS of EAE-inflicted mice. EAE was induced by myelin oligodendrocyte glycoprotein peptide, either in yellow fluorescent protein (YFP) 2.2 transgenic mice, which selectively express YFP on their neuronal population, or in C57BL/6 mice. The in situ effect of GA was studied in various brain regions; neuroprotection and neurogeneration were evaluated and quantified by measuring the expression of different neuronal antigens and in vivo proliferation markers. The results demonstrated that in EAE-inflicted mice, neuroproliferation was initially elevated after disease appearance but subsequently declined below that of naive mice. In contrast, GA treatment in various stages of the disease led to sustained reduction in the neuronal/axonal damage typical to the neurodegenerative disease course. Moreover, three processes characteristic of neurogenesis, namely cell proliferation, migration, and differentiation, were augmented and extended by GA treatment in EAE mice compared with EAE-untreated mice and naive controls. The newborn neuroprogenitors manifested massive migration through exciting and dormant migration pathways, into injury sites in brain regions, which do not normally undergo neurogenesis, and differentiated to mature neuronal phenotype. This suggests a direct linkage between immunomodulation, neurogenesis, and an in situ therapeutic consequence in the CNS.
Figures
Figure 1.
Clinical manifestations of EAE induced by MOG peptide 35–55. A, C57BL/6 and YFP2.2 mice. B, The effect of GA treatment in C57BL/6 mice treated by five to eight daily injections of GA in different stages of the disease [i.e., starting immediately after disease induction (prevention treatment), starting after the appearance of disease manifestations at day 20 (suppression treatment), or starting during the chronic phase 6 weeks after disease appearance (delayed suppression)]. The injection period of each treatment is illustrated along the _x_-axis. Six animals were tested in each treatment group.
Figure 2.
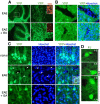
Histological manifestations of EAE induced by MOG peptide 35–55. A–D, The effect of GA treatment in sagittal brain sections of YFP2.2 mice expressing YFP (green) on their neuronal population. A, Deterioration and transaction of YFP-expressing fibers in the cerebellum and correlation with perivascular infiltration. The insets indicate areas with perivascular infiltrations, demonstrated by staining with antibodies for the T-cell markerCD3.B, Elimination of fibers in lesions in the striatum. Note the thin layer of YFP-positive fiber, frequently found over the lesions in GA-treated mice. C, Typical morphology of pyramidal cells in layer 5 of the cerebral cortex. The arrows and inset indicate abnormal neuronal cell bodies with marginalized nuclei in EAE mice. EAE was induced in YFP2.2 mice, 35 d before perfusion. GA treatment was applied by eight daily injections, starting immediately after EAE induction (prevention). Considerably less damages were found in the brains of EAE+GA mice than in the brains of untreated EAE mice (i.e., less deteriorating fibers, reduced number of lesions with smaller magnitude, and less swollen cell nuclei). D, Staining with Fluoro-Jade B (green), which binds to degenerating neurons, in the cortex of C57BL/6 mice 25 d after disease induction. Figures represent five mice in each group. Scale bar: A, 500 μm; B, C, 50 μm; D, 20 μm. L-2, L-5, and L-6, Layers two, five, and six of the cerebral cortex.
Figure 3.
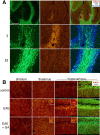
Microglial activation in EAE YFP2.2 mice. A, Correlation of the expression of the microglia and macrophage marker MAC-1 (red) with deterioration and injury of YFP-expressing fiber (green) in the white matter of the cerebellum. In box I, highly activated microglia cells are observed, accompanied by reduction in fiber density, whereas in the nearby area in box II, low MAC-1 expression and normal fiber appearance are present. B, The effect of GA on MAC-1 expression and on microglial cell morphology in various brain regions of EAE mice: striatum, thalamus (dorsal lateral geniculate nucleus), and hippocampus (granular and molecular layers). Increased MAC-1 staining and cell morphology typical for activated microglia were displayed in brains of EAE mice (insets). In contrast, MAC-1 expression in brains of EAE+GA mice was reduced extensively, exhibiting cell morphology similar to that of unactivated microglia in naive mice. EAE was induced in YFP2.2 mice 35 d before perfusion. GA treatment was applied by eight daily injections, starting immediately after EAE induction. Representative figures of four to five mice in each group (sagittal sections). Scale bar: A, 500 μm; B, 100 μm in the striatum and thalamus, 50 μm in the hippocampus.
Figure 4.
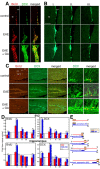
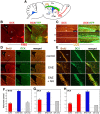
Proliferation of newly generated neurons visualized by immunostaining for the proliferation marker BrdU (red) and the immature neuronal marker DCX (green) in the neuroproliferative zones of C57BL/6 mice. Increased expression of BrdU and DCX in EAE mice and, to a greater extent, in EAE+GA mice in the SVZ (A; confocal images) and in the hippocampus (C) 25 d after EAE induction 1 d after the last GA injection. Right panels are high magnifications of the SGZ and the GCL. Note the DCX+ cells in the hippocampus that migrated into the GCL and manifest a dense and branched dendritic tree. B, DCX expression in the SVZ at different times points: 1 d (I), 10 d (II), and 30 d (III) after the last GA injection. Neuroproliferation declined with time; however, DCX expression in GA-treated mice was higher than that in EAE mice 1 and 10 d after treatment (coronal sections). Scale bar: A, 50 μm; B, C, 200 μm; C, right, 20 μm. st, Striatum; LV, lateral ventricle; IML, inner molecular layer; OML, outer molecular layer. D, Quantitative analysis of BrdU incorporation and DCX expression in EAE (red) and EAE+GA (blue) mice at various time points after EAE induction and GA treatment. Increased neuronal proliferation is observed in both neuroproliferative zones after disease appearance; subsequent decline is observed below that of naive mice and augmentation of neuroproliferation by the various schedules of GA treatment. Quantification was performed in the SVZ by counting BrdU-positive cells (Figure legend continues.)(Figure legend continued.) (those with BrdU/DCX dual staining) and measuring the DCX-stained area, starting at the level of the medial septum and 640 μm backward, and in the hippocampal DG by counting BrdU+/DCX+ cells (in both blades) and DCX+ cells (in the upper blade of the dentate) through its septotemporal axis. The number of BrdU/DCX-stained cells for each brain structure was averaged from eight unilateral levels per mouse (80 μm apart; 3–4 mice for treatment group). Results are expressed as change fold from naive controls. Control values for BrdU incorporation are as follows: SVZ, 211 ± 31 and 23 ± 6; hippocampus, 45 ± 13 and 17 ± 8; BrdU/DCX+ cells, 1 d and 1 month after the last BrdU injection, respectively; DCX staining, in the SVZ, 19, 464 ± 3550 μm2, in the hippocampus, 78 ± 12 -positive cells averaged from 10 naive mice. Statistical analysis was performed by ANOVA followed by Fisher's LSD when appropriate. The asterisk indicates a significant effect over naive control and a significant effect over EAE-untreated mice (p < 0.05). E, Schedule of experiments: time length from EAE induction (day 0) until perfusion; GA injections as prevention (P), suppression (S), or delayed suppression (DS) treatments and BrdU inoculation, concurrently or immediately after GA treatment.
Figure 5.
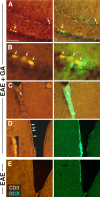
The association of T-cells with the neuroproliferative response induced by GA. CD3-stained T-cells (red) adjacent to DCX+ progenitor cells (green) in the SGZ of the hippocampus (A, B) and in the SVZ (C, D) of EAE+GA mice. T-cells were not detected in the neuroproliferative zones of EAE-untreated mice as shown in the SVZ (E). EAE was induced in C57BL/6 mice 35 d (A–C) and 55 d (D, E) before perfusion. GA treatment was applied by eight daily injections, starting at day 20 from induction, after the appearance of disease manifestations (suppression) (coronal sections). Scale bar: A, 64μm; B, 12μm; C, 100μm; D, 200μm.
Figure 6.
Promoted mobilization and migration of neuronal progenitor cells in EAE mice treated with GA through migratory streams. A, Schematic sagittal representation of the migratory routes from the SVZ through both the RMS (red) and the LCS (yellow). B, Sagittal section through the RMS showing the route of DCX-positive cells (red) from the SVZ to the OB. C, Neuroprogenitors in the LCS, generally functional in the embryonic forebrain and reappear after GA treatment in EAE adult mice. DCX-positive cells (red) migrate alongside the YFP-expressing fibers (green) of the interface between the hippocampus and the corpus callosum toward various cortical regions mainly in the occipital cortex. D, E, Increased mobilization of newly generated neurons visualized with BrdU (orange) and DCX (green) immunostaining in the RMS of EAE+GA mice, compared with EAE mice and naive controls, in an RMS segment adjacent to the SVZ (D) and in a more medial section of the RMS arc (E) (sagittal sections). Scale bar: B, 1000 μm; C, 25; D, 500; E, 50 μm. LV, Lateral ventricle; Ctx, cortex; St, striatum; AC, anterior commissure; cc, corpus callosum; Hip, hippocampus; L-5 and L-6, layers five and six of the cerebral cortex. F–H, Quantitative analysis of BrdU (coexpressing DCX) or DCX in the RMS 1 d (F, G) and 1 month (H) after termination of BrdU and GA injections, indicating a significant increase of neuroprogenitors in the RMS of EAE mice over control, and higher elevation in EAE+GA mice. Note that in one EAE mouse, which exhibited slight, short-term disease and spontaneous recovery (EAE-rec H), enhanced neuronal migration was observed. Quantification was performed by counting the BrdU+/DCX+ cells and measuring the DCX-stained area (0.22mm) along the striatal border. The amount of BrdU/DCX-stained cells was averaged from eight sections per mouse, 80 μm apart. Three mice counted per treatment group, except EAE rec, which shows a single mouse. Results are expressed as change fold from naive controls. Control values: BrdU incorporation, 146 ± 31 BrdU+/DCX+ cells, 1 d after the last BrdU injection; DCX staining, 2193±305 μm2, averaged from six naive mice. *p<0.05 versus naive control. EAE mice in B, C, and H were treated with GA subsequent to disease induction, 1 month before perfusion (prevention); in D–G, EAE-induced mice were injected with GA and BrdU 20 d after disease induction, 1–5 d before perfusion (suppression).
Figure 7.
Migration of neuronal progenitor cells in EAE-induced mice treated with GA. DCX-expressing neuronal progenitors (orange) diverge from the classic neuroproliferative zones or the migratory streams and spread to atypical regions along YFP-expressing fibers (green). A, From the RMS into the striatum. B, C, Toward the region of the nucleus accumbens, from the SVZ (B) and from the RMS (C). D, From the RMS into the internal part of the cortex to layer 5 (E) and layer 6 (F). Note the morphological features of the DCX-expressing cells, fusiform somata with leading and trailing processes (C, inset, E, F), characteristic of migrating neurons, and their orientation, migration away from the migratory stream, along the nerve fibers (A, D–F). Figures represent five GA-treated mice (sagittal sections). Scale bar: A–D, 200 μm; E, 100 μm; F, 10 μm. In A–C, the enlarged box area is depicted in the right panel. St, Striatum; AC, anterior commissure; cc, corpus callosum; L-5 and L-6, layers five and six of the cerebral cortex.
Figure 8.
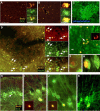
Fate tracing of neuronal progenitor cells generated in the course of GA treatment in EAE mice. BrdU-incorporated cells (red), born during the concurrent injections of BrdU and GA migrated to various brain regions and expressed neuronal markers. A, B, BrdU-positive cells coexpressing the immature neuronal marker DCX (green) 10 d after the last injection in the striatum (A) and the nucleus accumbens (B). Note the clusters of double-positive cells, suggesting local divisions. C, Staining of DCX-expressing cells in the nucleus accumbens with the endogenous proliferation marker phosphohistone (blue), showing DCX-positive cells that had proliferated in situ before the mouse was killed. D–G, BrdU-positive cells coexpressing the mature neuronal marker NeuN (green) 1 month after completion of GA/BrdU injections in the striatum (D, F), nucleus accumbens (E), and cingulate cortex layer 5 confocal image (G). Arrows indicate representative BrdU/NeuN-coexpressing cells. H–K, BrdU-positive cells 1 month after GA/BrdU injection in YFP mice, coexpressing YFP (green) in the cingulate layer 5 (H, I), occipital layer 6 (J), and motor layer 5 (K) of the cortex. Pyramidal cells with characteristic elongated apical dendrites and axons, indicative of mature functional neurons are shown. Representative figures of five GA-treated mice for each time point. G and K are confocal images (sagittal sections). Scale bar: A, B, H, 200 μm; C, D, 100 μm; E, I–K, 50 μm; F, G, 15 μm.
Figure 9.
Migration of neuronal progenitors to lesion sites. DCX-expressing cells (orange) were found in injured regions with deterioration of YFP-expressing fibers (green). A, EAE mice (not treated by GA), 35 d after disease induction, in the striatum. B–F, EAE mice, 35 d after disease induction, treated by GA (8 daily injections, starting immediately after disease induction, prevention). DCX-expressing cells are shown diverging from the RMS toward a lesion in the striatum (B), surrounding a lesion in the striatum (C), inside a lesion in the frontal cortex layer 5/6 (D, E), and in a cluster surrounding a lesion in the nucleus accumbens (F). Lesions in GA-treated mice were less extensive than those in untreated mice, yet the amount of progenitors adjoining these lesions was extensively higher. Note the YFP-expressing fibers extending into the lesions and the axonal sprouting in lesions occupied by DCX-expressing cells (D–F). Representative figures from four EAE and five EAE+GA mice (sagittal sections). Scale bar: A, B, 100 μm; C, D, F, 50 μm; E, 20 μm.
Figure 10.
GA-induced neuronal progenitors migrate to gliotic scar areas and express in situ BDNF. A–C, DCX-expressing cells (green) in regions populated with GFAP-expressing astrocytes (red) in the striatum. D–F, DCX-expressing cells (green) manifest extensive expression of BDNF (orange) in the nucleus accumbens (D, E) and the hippocampal dentate gyrus (F). Representative figures from five GA-treated mice (coronal sections). Scale bar: A–C, 100 μm; D, 50 μm; E, 12 μm; F, 30 μm.
Similar articles
- The immunomodulator glatiramer acetate augments the expression of neurotrophic factors in brains of experimental autoimmune encephalomyelitis mice.
Aharoni R, Eilam R, Domev H, Labunskay G, Sela M, Arnon R. Aharoni R, et al. Proc Natl Acad Sci U S A. 2005 Dec 27;102(52):19045-50. doi: 10.1073/pnas.0509438102. Epub 2005 Dec 19. Proc Natl Acad Sci U S A. 2005. PMID: 16365293 Free PMC article. - Distinct pathological patterns in relapsing-remitting and chronic models of experimental autoimmune enchephalomyelitis and the neuroprotective effect of glatiramer acetate.
Aharoni R, Vainshtein A, Stock A, Eilam R, From R, Shinder V, Arnon R. Aharoni R, et al. J Autoimmun. 2011 Nov;37(3):228-41. doi: 10.1016/j.jaut.2011.06.003. Epub 2011 Jul 14. J Autoimmun. 2011. PMID: 21752599 - Neurogenesis and neuroprotection in the CNS--fundamental elements in the effect of Glatiramer acetate on treatment of autoimmune neurological disorders.
Arnon R, Aharoni R. Arnon R, et al. Mol Neurobiol. 2007 Dec;36(3):245-53. doi: 10.1007/s12035-007-8002-z. Epub 2007 Oct 11. Mol Neurobiol. 2007. PMID: 17955199 Review. - Restoration of axon conduction and motor deficits by therapeutic treatment with glatiramer acetate.
Moore S, Khalaj AJ, Patel R, Yoon J, Ichwan D, Hayardeny L, Tiwari-Woodruff SK. Moore S, et al. J Neurosci Res. 2014 Dec;92(12):1621-36. doi: 10.1002/jnr.23440. Epub 2014 Jul 3. J Neurosci Res. 2014. PMID: 24989965 Free PMC article. - Neuroprotection and neurogeneration in MS and its animal model EAE effected by glatiramer acetate.
Arnon R, Aharoni R. Arnon R, et al. J Neural Transm (Vienna). 2009 Nov;116(11):1443-9. doi: 10.1007/s00702-009-0272-3. Epub 2009 Aug 11. J Neural Transm (Vienna). 2009. PMID: 19669693 Review.
Cited by
- Glial reactions and degeneration of myelinated processes in spinal cord gray matter in chronic experimental autoimmune encephalomyelitis.
Wu J, Ohlsson M, Warner EA, Loo KK, Hoang TX, Voskuhl RR, Havton LA. Wu J, et al. Neuroscience. 2008 Oct 15;156(3):586-96. doi: 10.1016/j.neuroscience.2008.07.037. Epub 2008 Jul 26. Neuroscience. 2008. PMID: 18718511 Free PMC article. - Neural stem cells derived from primitive mesenchymal stem cells reversed disease symptoms and promoted neurogenesis in an experimental autoimmune encephalomyelitis mouse model of multiple sclerosis.
Brown C, McKee C, Halassy S, Kojan S, Feinstein DL, Chaudhry GR. Brown C, et al. Stem Cell Res Ther. 2021 Sep 9;12(1):499. doi: 10.1186/s13287-021-02563-8. Stem Cell Res Ther. 2021. PMID: 34503569 Free PMC article. - Debate: "is increasing neuroinflammation beneficial for neural repair?".
Crutcher KA, Gendelman HE, Kipnis J, Perez-Polo JR, Perry VH, Popovich PG, Weaver LC. Crutcher KA, et al. J Neuroimmune Pharmacol. 2006 Sep;1(3):195-211. doi: 10.1007/s11481-006-9021-7. Epub 2006 May 23. J Neuroimmune Pharmacol. 2006. PMID: 18040798 Review. No abstract available. - Positive effect of immunomodulatory therapies on disease progression in Huntington's disease? Data from a real-world cohort.
Achenbach J, Saft C, Faissner S, Ellrichmann G. Achenbach J, et al. Ther Adv Neurol Disord. 2022 Jul 23;15:17562864221109750. doi: 10.1177/17562864221109750. eCollection 2022. Ther Adv Neurol Disord. 2022. PMID: 35899100 Free PMC article. - AAV serotype 2/1-mediated gene delivery of anti-inflammatory interleukin-10 enhances neurogenesis and cognitive function in APP+PS1 mice.
Kiyota T, Ingraham KL, Swan RJ, Jacobsen MT, Andrews SJ, Ikezu T. Kiyota T, et al. Gene Ther. 2012 Jul;19(7):724-33. doi: 10.1038/gt.2011.126. Epub 2011 Sep 15. Gene Ther. 2012. PMID: 21918553 Free PMC article.
References
- Aharoni R, Teitelbaum D, Sela M, Arnon R (1998) Bystander suppression of experimental autoimmune encephalomyelitis by T cell lines and clones of the Th2 type induced by copolymer 1. J Neuroimmunol 2: 135–146. - PubMed
- Aharoni R, Meshorer A, Sela M, Arnon R (2002) Oral treatment of mice with copolymer 1 (glatiramer acetate) results in the accumulation of specific Th2 cells in the central nervous system. J Neuroimmunol 126: 58–68. - PubMed
- Aharoni R, Eilam R, Labunskay G, Sela M, Arnon R (2004) Copaxone (glatiramer acetate) injection augment brain derived neurotrophic factor expression in the brain. Multiple Sclerosis 10: S256.
Publication types
MeSH terms
Substances
LinkOut - more resources
Full Text Sources
Other Literature Sources

