Systematic survey reveals general applicability of "guilt-by-association" within gene coexpression networks - PubMed (original) (raw)
Systematic survey reveals general applicability of "guilt-by-association" within gene coexpression networks
Cecily J Wolfe et al. BMC Bioinformatics. 2005.
Abstract
Background: Biological processes are carried out by coordinated modules of interacting molecules. As clustering methods demonstrate that genes with similar expression display increased likelihood of being associated with a common functional module, networks of coexpressed genes provide one framework for assigning gene function. This has informed the guilt-by-association (GBA) heuristic, widely invoked in functional genomics. Yet although the idea of GBA is accepted, the breadth of GBA applicability is uncertain.
Results: We developed methods to systematically explore the breadth of GBA across a large and varied corpus of expression data to answer the following question: To what extent is the GBA heuristic broadly applicable to the transcriptome and conversely how broadly is GBA captured by a priori knowledge represented in the Gene Ontology (GO)? Our study provides an investigation of the functional organization of five coexpression networks using data from three mammalian organisms. Our method calculates a probabilistic score between each gene and each Gene Ontology category that reflects coexpression enrichment of a GO module. For each GO category we use Receiver Operating Curves to assess whether these probabilistic scores reflect GBA. This methodology applied to five different coexpression networks demonstrates that the signature of guilt-by-association is ubiquitous and reproducible and that the GBA heuristic is broadly applicable across the population of nine hundred Gene Ontology categories. We also demonstrate the existence of highly reproducible patterns of coexpression between some pairs of GO categories.
Conclusion: We conclude that GBA has universal value and that transcriptional control may be more modular than previously realized. Our analyses also suggest that methodologies combining coexpression measurements across multiple genes in a biologically-defined module can aid in characterizing gene function or in characterizing whether pairs of functions operate together.
Figures
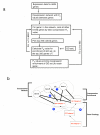
Figure 1
Schematic representation of the steps in our analyses. (a) Example flow chart of the different steps for calculating gene set coexpression enrichment P e values between each of the 6624 genes in the multi-species network and 902 GO sets. For each gene m i we use the hypergeometric distribution to calculate a coexpression enrichment P _e_-value (P e(m i, g j)) for whether GO set g j was significantly overrepresented in the top 250 genes with smallest P _c_-values to m i. (b) The four steps in our analyses. 1. A coexpression network is generated with P c values (multi-species network) or correlation coefficients (single-species network) scoring coexpression between gene pairs. 2. Coexpression enrichment P e values are calculated between each gene and each GO category, such as between GO category 1 and genes A, B, and C and between GO category 2 and genes A, B, and C. 3. A score reflecting GBA is calculated for each GO category (e.g., GO category 1). 4. The interrelationship between pairs of GO categories is quantified, such as that between GO category 1 and GO category 2, which are sibling categories in a Gene Ontology graph, sharing GO category 3 as a common parent.
Figure 2
Examples from the multi-species network. (a-d) Self-diagnostic Receiver Operating Characteristic (ROC) curves for the GO categories shown above.
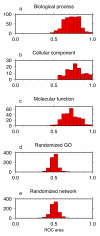
Figure 3
Histograms of self-diagnostic ROC areas for the multi-species network. (a) Histogram for biological process GO categories. (b) Histogram for cellular component GO categories. (c) Histogram for molecular function GO categories. (d) Histogram for randomized GO sets. (d) Histogram for a randomized multi-species coexpression network.
Figure 4
Histograms of cross-diagnostic ROC areas for the multi-species network. (a) Histogram of ROC areas for whether descendent P _e_-values are diagnostic of parent sets. (b) Histogram of ROC areas for cross pairing of sibling categories. (c) Histogram of ROC areas for all cross pairings of categories (excluding parent-descendent pairs) with distances of 3–16 in a GO graph. GO organizes categories as nodes on a graph and calculates the distance between category pairs on the same graph as the minimum number of arcs needed to traverse from one category node to another on the graph. For example, a parent and its child are separated by a distance of one and siblings are separated by distances of two. (d) Histogram of ROC areas for all cross pairings of categories (excluding parent-descendent pairs) with distances of 3–16 in a GO graph, created using randomized GO sets. (e) Histogram of cross-diagnostic ROC areas between GO category pairs (excluding parent-descendent pairs) in the subgraph below immune response. (f) Histogram of cross-diagnostic ROC areas between GO category pairs (excluding parent-descendent pairs) in the subgraph below cell cycle.
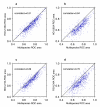
Figure 5
Plots of self-diagnostic ROC areas from the multi-species network (x-axis) versus ROC areas from a single-species network (y-axis) for each GO category. Each panel examines one of the single-species networks, created using microarrays from the following Affymetrix platforms: HG-U133A (human), HG-U95A (human), MG-U74A (mouse), and RG-U34A (rat). Correlation coefficients are noted in the upper left corner of the plots.
Similar articles
- Proteome Profiling Outperforms Transcriptome Profiling for Coexpression Based Gene Function Prediction.
Wang J, Ma Z, Carr SA, Mertins P, Zhang H, Zhang Z, Chan DW, Ellis MJ, Townsend RR, Smith RD, McDermott JE, Chen X, Paulovich AG, Boja ES, Mesri M, Kinsinger CR, Rodriguez H, Rodland KD, Liebler DC, Zhang B. Wang J, et al. Mol Cell Proteomics. 2017 Jan;16(1):121-134. doi: 10.1074/mcp.M116.060301. Epub 2016 Nov 11. Mol Cell Proteomics. 2017. PMID: 27836980 Free PMC article. - Network‑based gene function inference method to predict optimal gene functions associated with fetal growth restriction.
Ye KJ, Dai J, Liu LY, Peng MJ. Ye KJ, et al. Mol Med Rep. 2018 Sep;18(3):3003-3010. doi: 10.3892/mmr.2018.9232. Epub 2018 Jun 29. Mol Med Rep. 2018. PMID: 30015878 - Assessment and integration of publicly available SAGE, cDNA microarray, and oligonucleotide microarray expression data for global coexpression analyses.
Griffith OL, Pleasance ED, Fulton DL, Oveisi M, Ester M, Siddiqui AS, Jones SJ. Griffith OL, et al. Genomics. 2005 Oct;86(4):476-88. doi: 10.1016/j.ygeno.2005.06.009. Genomics. 2005. PMID: 16098712 - Comparative co-expression analysis in plant biology.
Movahedi S, Van Bel M, Heyndrickx KS, Vandepoele K. Movahedi S, et al. Plant Cell Environ. 2012 Oct;35(10):1787-98. doi: 10.1111/j.1365-3040.2012.02517.x. Epub 2012 May 10. Plant Cell Environ. 2012. PMID: 22489681 Review.
Cited by
- Transcriptomic meta-analysis reveals unannotated long non-coding RNAs related to the immune response in sheep.
Bilbao-Arribas M, Jugo BM. Bilbao-Arribas M, et al. Front Genet. 2022 Nov 22;13:1067350. doi: 10.3389/fgene.2022.1067350. eCollection 2022. Front Genet. 2022. PMID: 36482891 Free PMC article. - Genome-wide matching of genes to cellular roles using guilt-by-association models derived from single sample analysis.
Klomp JA, Furge KA. Klomp JA, et al. BMC Res Notes. 2012 Jul 23;5:370. doi: 10.1186/1756-0500-5-370. BMC Res Notes. 2012. PMID: 22824328 Free PMC article. - Functional modules in the Arabidopsis core cell cycle binary protein-protein interaction network.
Boruc J, Van den Daele H, Hollunder J, Rombauts S, Mylle E, Hilson P, Inzé D, De Veylder L, Russinova E. Boruc J, et al. Plant Cell. 2010 Apr;22(4):1264-80. doi: 10.1105/tpc.109.073635. Epub 2010 Apr 20. Plant Cell. 2010. PMID: 20407024 Free PMC article. - Threshold selection in gene co-expression networks using spectral graph theory techniques.
Perkins AD, Langston MA. Perkins AD, et al. BMC Bioinformatics. 2009 Oct 8;10 Suppl 11(Suppl 11):S4. doi: 10.1186/1471-2105-10-S11-S4. BMC Bioinformatics. 2009. PMID: 19811688 Free PMC article. - Systems medicine: the future of medical genomics and healthcare.
Auffray C, Chen Z, Hood L. Auffray C, et al. Genome Med. 2009 Jan 20;1(1):2. doi: 10.1186/gm2. Genome Med. 2009. PMID: 19348689 Free PMC article.
References
Publication types
MeSH terms
Substances
Grants and funding
- 2TA5 LM07092-11/LM/NLM NIH HHS/United States
- 5T15 LM07092/LM/NLM NIH HHS/United States
- T15 LM007092/LM/NLM NIH HHS/United States
- R01 DK62948/DK/NIDDK NIH HHS/United States
- U54 LM008748/LM/NLM NIH HHS/United States
- K12 DK063696/DK/NIDDK NIH HHS/United States
- R01 DK062948/DK/NIDDK NIH HHS/United States
- K12 DK63696/DK/NIDDK NIH HHS/United States
LinkOut - more resources
Full Text Sources
Other Literature Sources
Research Materials


