Hematopoietic stem cell fate is established by the Notch-Runx pathway - PubMed (original) (raw)
Hematopoietic stem cell fate is established by the Notch-Runx pathway
Caroline Erter Burns et al. Genes Dev. 2005.
Abstract
Identifying the molecular pathways regulating hematopoietic stem cell (HSC) specification, self-renewal, and expansion remains a fundamental goal of both basic and clinical biology. Here, we analyzed the effects of Notch signaling on HSC number during zebrafish development and adulthood, defining a critical pathway for stem cell specification. The Notch signaling mutant mind bomb displays normal embryonic hematopoiesis but fails to specify adult HSCs. Surprisingly, transient Notch activation during embryogenesis via an inducible transgenic system led to a Runx1-dependent expansion of HSCs in the aorta-gonad-mesonephros (AGM) region. In irradiated adults, Notch activity induced runx1 gene expression and increased multilineage hematopoietic precursor cells approximately threefold in the marrow. This increase was followed by the accelerated recovery of all the mature blood cell lineages. These data define the Notch-Runx pathway as critical for the developmental specification of HSC fate and the subsequent homeostasis of HSC number, thus providing a mechanism for amplifying stem cells in vivo.
Figures
Figure 1.
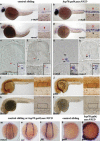
Mind bomb is required for definitive HSC specification, but is dispensable for primitive hematopoiesis. Whole-mount in situ hybridization was performed on wild-type and mind bomb embryos. Genotype is indicated prior to each row, and the probe used is listed in each panel. (a,b,d,e) Lateral view, 36 hpf. Low magnification (10×) and higher magnification (40×) of the trunk region. HSC expression is indicated by arrowheads in a and b. (c,f) Dorsal view, 4 dpf. Bilateral rag-1 expression in thymi is indicated by arrowheads in c. (g_–_r) Lateral view, 28 hpf. (g,j) Low magnification (10×) and higher magnification (40×) of the trunk region. Aortic expression is indicated by red arrowheads; intersomitic vessels are indicated by green arrowheads. (h_–_l) Black arrowheads indicate the embryonic red cell in the ICM. (m_–_r) Black arrowheads indicate spotted expression in primitive myeloid cells.
Figure 2.
NICD expands HSC/progenitor cells in the AGM. Whole-mount in situ hybridization was performed on control sibling and hsp70:gal4;uas:NICD embryos (see Materials and Methods for heat-shock conditions). Red arrowheads denote aorta expression, and black arrowheads show vein expression. The probe used is listed in each panel. (a_–_d) Lateral view. Low magnification (10×) and higher magnification (40×) of the trunk region. hsp70:gal4;uas:NICD transgenics show expanded HSC markers throughout the artery and vein. (e_–_h) Plastic sections through the trunk region of 36–40 hpf whole-mount in situ hybridized embryos. (e,f) Note ventrally restricted c-myb and runx1 aortic expression. (g,h) Note ectopic expansion of c-myb and runx1 to the aortic roof and vein. pH3 immunostaining at ∼40 hpf (i,j) (see Materials and Methods) and BrdU incorporation at ∼40 hpf (k,l). Compare brown stain in dividing cells in vessel region of wild-type (i,k) to hsp70:gal4;uas:NICD (j,l). (m_–_q) Approximately 10–12 somite stage. (m_–_o) Dorsal view; (p,q) lateral view.
Figure 3.
NICD dose-dependently expands HSCs independent of aortic cell fate. Whole-mount in situ hybridization was performed on hsp70:gal4;uas:NICD embryos heat-shocked at 40°C for 1, 10, or 20 min. Red arrowheads denote aorta expression, and black arrow-heads show vein expression. The arrowhead size suggests the level of transcript present. Low magnification (10×) and higher magnification (40×) of the trunk region. (a,d,g) c-myb HSC expression. (b,e,h) runx1 HSC expression. (c,f,i) ephrinB2a arterial expression.
Figure 4.
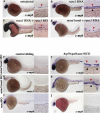
Runx1 is dispensable for aortic cell fate. Whole-mount in situ hybridization was performed on wild-type and _runx_MO-injected embryos at ∼28 hpf. Embryo manipulation is indicated above each column, and probes used are indicated to the left of each row. Lateral views. Low magnification (10×) and higher magnification (40×) of the trunk region. Red arrowheads denote aorta expression, black arrowheads show vein expression, and green arrowheads mark aortic intersomitic vessels. fli1 (a,b) and flk1 (c,d) expression in wild-type and _runx_MO-injected embryos. Note lack of intersomitic vessels in _runx_MO animals. (e_–_j) notch3, deltaC, and ephrinb2a aortic expression is maintained in _runx_MO-injected animals. Loss of c-myb at 36 hpf served as a positive control for the runx morphant phenotype.
Figure 5.
Runx1 is required for NICD-dependent HSC expansion in the AGM. Whole-mount in situ hybridization on 36–40 hpf embryos. Embryo manipulation, genotype, and probes used are described for each panel. Red arrowheads show the artery, and black arrowheads highlight the vein. Lateral views. Low magnification (10×) and higher magnification (40×) of the trunk region. Injection of ∼10 pg of runx1 mRNA expands _c-myb_-positive HSCs in wild type (cf. a and b), rescues HSCs in runx morphants (cf. Supplementary Figs. 1d and 5c), and rescues HSCs in mind bomb mutants (cf. Figs. 1d and d). (e_–_j) mind bomb or runx morpholinos were injected into embryos derived from hsp70:gal4 and uas:NICD intercrosses. After heat shock (see Materials and Methods), injected embryos were hybridized with labeled c-myb or runx1 probes. The hsp70:gal4;uas:NICD HSC expansion phenotype is evident in the presence of _mib_MO (e_–_h), but is absent in the presence of _runx_MO (i,j).
Figure 6.
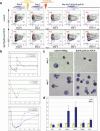
NICD expands the multilineage precursor cells in adult marrow and accelerates blood lineage recovery post-irradiation. (a) Cartoon depicting manipulation of adult control sibling or hsp70:gal4;uas:NICD fish is outlined. Light scatter profiles of whole kidney marrow from adult control sibling or hsp70:gal4;uas:NICD fish showing the effects of sublethal irradiation and heat shock on the relative percentages of erythrocytes (red gate), lymphocytes (blue gate), precursors (purple gate), and myelomonocytes (green gate) over time. Each FACS plot is of one representative fish from each time point, and the percentages reflect the average number of cells in each gate. The erythroid population is excluded from our analyses due to a marked variability in the numbers extracted from whole kidney dissections. This inconsistency has been previously reported (Traver et al. 2004) and is likely due to the close association of the kidney with the dorsal aorta. (b) The average percentage of cells in each gate (_Y_-axis, shown as percentages in a), with the exception of erythroid, was plotted over time (_X_-axis). (c) Cytospin preparation of day 4 (top) or day 7 (bottom) whole kidney marrow from control sibling (left) or hsp70:gal4;uas:NICD adults (right). (d) Quantitative PCR analysis from control sibling or hsp70:gal4;uas:NICD whole kidney marrow on day 3 (see Materials and Methods). The average fold induction of each transcript is represented by the bar graph with standard deviations. (WT) Wild type; (TG) hsp70:gal4;uas:NICD; (lp) lymphocyte precursor; (ep) erythroid precursor; (mp) myeloid precursor.
Similar articles
- Development of multilineage adult hematopoiesis in the zebrafish with a runx1 truncation mutation.
Sood R, English MA, Belele CL, Jin H, Bishop K, Haskins R, McKinney MC, Chahal J, Weinstein BM, Wen Z, Liu PP. Sood R, et al. Blood. 2010 Apr 8;115(14):2806-9. doi: 10.1182/blood-2009-08-236729. Epub 2010 Feb 12. Blood. 2010. PMID: 20154212 Free PMC article. - A genetic screen in zebrafish defines a hierarchical network of pathways required for hematopoietic stem cell emergence.
Burns CE, Galloway JL, Smith AC, Keefe MD, Cashman TJ, Paik EJ, Mayhall EA, Amsterdam AH, Zon LI. Burns CE, et al. Blood. 2009 Jun 4;113(23):5776-82. doi: 10.1182/blood-2008-12-193607. Epub 2009 Mar 30. Blood. 2009. PMID: 19332767 Free PMC article. - Live imaging of Runx1 expression in the dorsal aorta tracks the emergence of blood progenitors from endothelial cells.
Lam EY, Hall CJ, Crosier PS, Crosier KE, Flores MV. Lam EY, et al. Blood. 2010 Aug 12;116(6):909-14. doi: 10.1182/blood-2010-01-264382. Epub 2010 May 7. Blood. 2010. PMID: 20453160 - Notch Signaling in HSC Emergence: When, Why and How.
Thambyrajah R, Bigas A. Thambyrajah R, et al. Cells. 2022 Jan 21;11(3):358. doi: 10.3390/cells11030358. Cells. 2022. PMID: 35159166 Free PMC article. Review. - The embryonic aorta-gonad-mesonephros region as a generator of haematopoietic stem cells.
Pietilä I, Vainio S. Pietilä I, et al. APMIS. 2005 Nov-Dec;113(11-12):804-12. doi: 10.1111/j.1600-0463.2005.apm_368.x. APMIS. 2005. PMID: 16480451 Review.
Cited by
- NOTCH1 promotes T cell leukemia-initiating activity by RUNX-mediated regulation of PKC-θ and reactive oxygen species.
Giambra V, Jenkins CR, Wang H, Lam SH, Shevchuk OO, Nemirovsky O, Wai C, Gusscott S, Chiang MY, Aster JC, Humphries RK, Eaves C, Weng AP. Giambra V, et al. Nat Med. 2012 Nov;18(11):1693-8. doi: 10.1038/nm.2960. Epub 2012 Oct 21. Nat Med. 2012. PMID: 23086478 Free PMC article. - The zebrafish reveals dependence of the mast cell lineage on Notch signaling in vivo.
Da'as SI, Coombs AJ, Balci TB, Grondin CA, Ferrando AA, Berman JN. Da'as SI, et al. Blood. 2012 Apr 12;119(15):3585-94. doi: 10.1182/blood-2011-10-385989. Epub 2012 Feb 24. Blood. 2012. PMID: 22368273 Free PMC article. - Overlapping Requirements for Tet2 and Tet3 in Normal Development and Hematopoietic Stem Cell Emergence.
Li C, Lan Y, Schwartz-Orbach L, Korol E, Tahiliani M, Evans T, Goll MG. Li C, et al. Cell Rep. 2015 Aug 18;12(7):1133-43. doi: 10.1016/j.celrep.2015.07.025. Epub 2015 Aug 6. Cell Rep. 2015. PMID: 26257178 Free PMC article. - Prostaglandin E2 regulates vertebrate haematopoietic stem cell homeostasis.
North TE, Goessling W, Walkley CR, Lengerke C, Kopani KR, Lord AM, Weber GJ, Bowman TV, Jang IH, Grosser T, Fitzgerald GA, Daley GQ, Orkin SH, Zon LI. North TE, et al. Nature. 2007 Jun 21;447(7147):1007-11. doi: 10.1038/nature05883. Nature. 2007. PMID: 17581586 Free PMC article. - Expression analysis of Runx3 and other Runx family members during Xenopus development.
Park BY, Saint-Jeannet JP. Park BY, et al. Gene Expr Patterns. 2010 Jun;10(4-5):159-66. doi: 10.1016/j.gep.2010.04.004. Epub 2010 Apr 28. Gene Expr Patterns. 2010. PMID: 20433948 Free PMC article.
References
- Arai F., Hirao, A., Ohmura, M., Sato, H., Matsuoka, S., Takubo, K., Ito, K., Koh, G.Y., and Suda, T. 2004. Tie2/angiopoietin-1 signaling regulates hematopoietic stem cell quiescence in the bone marrow niche. Cell 118: 149-161. - PubMed
- Avecilla S.T., Hattori, K., Heissig, B., Tejada, R., Liao, F., Shido, K., Jin, D.K., Dias, S., Zhang, F., Hartman, T.E., et al. 2004. Chemokine-mediated interaction of hematopoietic progenitors with the bone marrow vascular niche is required for thrombopoiesis. Nat. Med. 10: 64-71. - PubMed
- Baron M. 2001. Induction of embryonic hematopoietic and endothelial stem/progenitor cells by hedgehog-mediated signals. Differentiation 68: 175-185. - PubMed
- Bhardwaj G., Murdoch, B., Wu, D., Baker, D.P., Williams, K.P., Chadwick, K., Ling, L.E., Karanu, F.N., and Bhatia, M. 2001. Sonic hedgehog induces the proliferation of primitive human hematopoietic cells via BMP regulation. Nat. Immunol. 2: 172-180. - PubMed
- Bray S. 1998. Notch signalling in Drosophila: Three ways to use a pathway. Semin. Cell Dev. Biol. 9: 591-597. - PubMed
Publication types
MeSH terms
Substances
Grants and funding
- K01 DK067179/DK/NIDDK NIH HHS/United States
- R01 HL048801/HL/NHLBI NIH HHS/United States
- 1 K01 DK067179-01 A1/DK/NIDDK NIH HHS/United States
- 5 R01 HL48801-13/HL/NHLBI NIH HHS/United States
LinkOut - more resources
Full Text Sources
Other Literature Sources
Medical
Molecular Biology Databases


