TCR stimulation with modified anti-CD3 mAb expands CD8+ T cell population and induces CD8+CD25+ Tregs - PubMed (original) (raw)
. 2005 Oct;115(10):2904-13.
doi: 10.1172/JCI23961. Epub 2005 Sep 15.
Affiliations
- PMID: 16167085
- PMCID: PMC1201661
- DOI: 10.1172/JCI23961
TCR stimulation with modified anti-CD3 mAb expands CD8+ T cell population and induces CD8+CD25+ Tregs
Brygida Bisikirska et al. J Clin Invest. 2005 Oct.
Abstract
Modified anti-CD3 mAbs are emerging as a possible means of inducing immunologic tolerance in settings including transplantation and autoimmunity such as in type 1 diabetes. In a trial of a modified anti-CD3 mAb [hOKT3gamma1(Ala-Ala)] in patients with type 1 diabetes, we identified clinical responders by an increase in the number of peripheral blood CD8+ cells following treatment with the mAb. Here we show that the anti-CD3 mAb caused activation of CD8+ T cells that was similar in vitro and in vivo and induced regulatory CD8+CD25+ T cells. These cells inhibited the responses of CD4+ cells to the mAb itself and to antigen. The regulatory CD8+CD25+ cells were CTLA4 and Foxp3 and required contact for inhibition. Foxp3 was also induced on CD8+ T cells in patients during mAb treatment, which suggests a potential mechanism of the anti-CD3 mAb immune modulatory effects involving induction of a subset of regulatory CD8+ T cells.
Figures
Figure 1
Anti-CD3 hOKT3γ1(Ala-Ala) antibody stimulates in vitro proliferation of human PBMCs. PBMCs were cultured for 5 days in the presence of hOKT3γ1(Ala-Ala) antibody at the indicated concentrations. Cell proliferation level was determined by [3H]thymidine uptake. Results are expressed as the mean value of duplicates and are representative of 3 independent experiments.
Figure 2
Diverse in vitro response of CD8+ and CD4+ subpopulations of human PBMCs to hOKT3γ1(Ala-Ala) stimulation. CFSE-labeled PBMCs were cultured in the presence of hOKT3γ1(Ala-Ala) (A and B) or PHA (C and D) for 6 days. Cells were labeled with fluorochrome-conjugated anti-CD4 and anti-CD8 and analyzed by flow cytometry. (A and C) CD8-gated cells. (B and D) CD4-gated cells. Gray histograms: cells without stimulation. Results from a single experiment representative of 6 experiments are shown.
Figure 3
Changes in CD4/CD8 T cell ratio in subjects with type 1 diabetes receiving hOKT3γ1(Ala-Ala) in relation to EBV status at study entry, and correlation between changes in CD4+ and CD8+ T cells in vitro during culture with anti-CD3 mAb and in vivo following treatment with anti-CD3 mAb. (A) The difference in the CD4/CD8 T cell ratio 3 months after treatment with hOKT3γ1(Ala-Ala) from the ratio before drug treatment in individuals who were EBV seropositive (n = 12) or seronegative (n = 7) at study entry was determined. The dark lines indicate the mean values for the group. A decrease in the CD4/CD8 T cell ratio (below the dotted line) occurred in both EBV-seropositive and -seronegative subjects. (B) PBMCs from patients with type 1 diabetes mellitus who received anti-CD3 mAb were studied 1.5–2 years after mAb treatment, at which time the changes in CD4/CD8 T cell ratio seen after mAb treatment had resolved. The patients were designated as clinical responders (filled circles) or nonresponders (open circles) based on their C-peptide responses at 12 months compared with baseline. The cells were cultured with hOKT3γ1(Ala-Ala), and the percentages of CD4+ and CD8+ T cells were determined after 6 days. The Pearson correlation coefficient was calculated to compare the ratio of CD4+/CD8+ T cells in vitro with the analysis of CD4+/CD8+ T cells in vivo 3 months after mAb treatment (8), and the level of significance was tested with correlation procedure SAS (r = 0.6; P = 0.024). The line indicates the relationship between the changes in vitro and in vivo [in vivo CD4/CD8 ratio = 0.174 + 0.865 (in vitro CD4/CD8 ratio)].
Figure 4
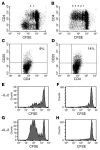
Reduced proliferative response of CD4+ cells to hOKT3γ1(Ala-Ala) stimulation occurs only in the presence of CD8+ cells but is not due to lack of IL-2. CFSE-labeled cells were cultured in the presence of hOKT3γ1(Ala-Ala) for 6 days. Cells were stained with PE-conjugated anti-CD4 and anti-CD25 mAbs and analyzed on a FACSCalibur flow cytometer. (A and C) Bulk PBMCs. (B and D) PBMCs depleted of CD8+ T cells. Representative results of 6 independent experiments are shown. The numbers over the dots in A and B represent the number of cell divisions. The percentages in C and D represent the percentage of CD4+ cells that were CD25+. PBMCs were cultured with the anti-CD3 mAb in the absence (E and F) or presence (G and H) of recombinant IL-2 (50 U/ml). The addition of IL-2 to the cultures enhanced proliferation of CD8+ T cells (E and G) but did not have an effect on CD4+ T cell proliferation in the PBMCs (F and H). Representative results of 4 independent experiments are shown.
Figure 5
CD8+ lymphocytes from PBMC cultures stimulated with hOKT3γ1(Ala-Ala) suppress tetanus-specific response. CD8 cells isolated from fresh PBMCs (CD8 none; white bars) or from PBMCs cultured for 6 days in the presence of hOKT3γ1(Ala-Ala) (gray bars) were irradiated and mixed with fresh PBMCs depleted of CD8+ T cells at the indicated ratios. Cells were cultured with or without the presence of tetanus toxoid for 3 days. Cell proliferation was determined by [3H]thymidine uptake, and the data are expressed as the difference (in counts per minute) between cultures with and without antigen. The background counts (responder cells with CD8+ cells in the absence of antigen) ranged between 542 and 1,796 cpm. Representative results of 3 independent experiments are shown.
Figure 6
Suppression of CD4+ cell proliferation by CD8+ lymphocytes is not mediated by soluble factors. CFSE-labeled cells were cultured in the presence of hOKT3γ1(Ala-Ala) for 6 days. Cells were labeled with fluorochrome-conjugated anti-surface marker mAb and analyzed by flow cytometry. Histograms were gated on CD4+ lymphocytes. Shown are PBMCs (top panel), CD8-depleted PBMCs separated by Transwell membrane from CD4-depleted PBMCs (middle panel), and CD8-depleted PBMCs (bottom panel). The numbers in each histogram represent the percentage of CD4+ cells with dilution of CFSE. Results are representative of 4 independent experiments.
Figure 7
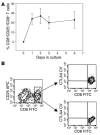
Induction of CD25+ population in CD8 cells stimulated with hOKT3γ1(Ala-Ala). (A) Freshly isolated PBMCs were cultured in the presence of hOKT3γ1(Ala-Ala) for 6 days. For analysis of CD25 expression, cells were collected on days 0 (before stimulation), 1, 2, 3, and 6 of the culture, labeled with flourochrome-conjugated anti-CD8 and anti-CD25, and analyzed by flow cytometry. The results are presented as a ratio of CD8+CD25+-expressing cells to total CD8+ cells. Mean values (± SEM) of 4 independent experiments are shown. (B) Intracellular expression of CTLA4 analyzed by flow cytometry. Left: gated CD8 lymphocytes; upper right: gated CD8+CD25+ cells; lower right: gated CD8+CD25– cells. Representative results from 3 independent experiments are shown. CTLA4CV, CTLA4 CyChrome.
Figure 8
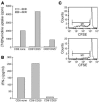
The CD8+CD25+ cells induced with hOKT3γ1(Ala-Ala) suppress CD4 cell response to SEB and IFN-γ secretion. (A) CD8+CD25+ or CD8+CD25– cells sorted from PBMCs stimulated for 6 days with hOKT3γ1(Ala-Ala) or CD8+ cells from fresh PBMCs were irradiated and cocultured for 3 days with fresh PBMCs depleted of CD8 in the presence of SEB. Proliferative response was assessed by [3H]thymidine uptake. (B) The levels of IFN-γ in the supernatants from the same cultures were measured by Luminex system using Th1/Th2 multiplex microspheres. Representative results of 2 independent experiments are shown. (C) Sorted CD8+CD25+ (bottom panel) or untreated CD8 cells (upper panel) were cocultured for 6 days with CFSE-labeled, CD8-depleted PBMCs at 1:2 ratio in the presence of SEB. SEB-specific clonal expansion was analyzed by flow cytometry. The expansion of Vβ3-positive CD4 (M1) lymphocytes was reduced from 46.1% to 15.5% of Vβ3+ T cells. Similar results were obtained in 2 additional studies.
Figure 9
Increased expression of Foxp3 in CD8+CD25+ cells induced with hOKT3γ1(Ala-Ala). (A) PBMCs were cultured for 6 days with hOKT3γ1(Ala-Ala) and sorted based on the expression of CD25. Foxp3 expression was measured by quantitative real-time PCR. Results are presented as Foxp3 gene expression normalized to GAPDH expression, and the results for CD8+CD25+ or CD8+CD25– cells were compared with those for freshly isolated CD8+ T cells from the same subject. Mean values (±SD) of 4 independent experiments are shown. **P ≤ 0.02. (B) Expression of Foxp3 was studied in CD8+CD25+ and CD8+CD25– cells from the same cultures by Western blotting and was detected at higher levels in CD8+CD25+ cells.
Figure 10
Changes in Foxp3 expression in vivo in CD8+ PBMCs following treatment with anti-CD3 mAb. CD8+ T cells were isolated from the same individual before (first draw) and after (second draw) treatment with anti-CD3 mAb (filled symbols; n = 4) or in control subjects with type 1 diabetes (open symbols) on 2 (n = 3) or 3 (n = 1) occasions. The expression of Foxp3 relative to CD8 (×100) for each individual is plotted (A), and the average ratio of the second/first sampling in each group (± SEM) is shown (B). **P = 0.02.
Similar articles
- Acquisition of regulatory function by human CD8(+) T cells treated with anti-CD3 antibody requires TNF.
Ablamunits V, Bisikirska B, Herold KC. Ablamunits V, et al. Eur J Immunol. 2010 Oct;40(10):2891-901. doi: 10.1002/eji.201040485. Eur J Immunol. 2010. PMID: 21038470 Free PMC article. - CD8 blockade promotes the expansion of antigen-specific CD4+ FOXP3+ regulatory T cells in vivo.
Wang Z, Davies JD. Wang Z, et al. Int Immunopharmacol. 2007 Feb;7(2):249-65. doi: 10.1016/j.intimp.2006.10.012. Epub 2006 Nov 28. Int Immunopharmacol. 2007. PMID: 17178393 Free PMC article. - Human fetal retinal pigment epithelium suppresses the activation of CD4(+) and CD8(+) T-cells.
Farrokh-Siar L, Rezai KA, Semnani RT, Patel SC, Ernest JT, van Seventer GA. Farrokh-Siar L, et al. Graefes Arch Clin Exp Ophthalmol. 1999 Nov;237(11):934-9. doi: 10.1007/s004170050389. Graefes Arch Clin Exp Ophthalmol. 1999. PMID: 10541905 - Use of anti-CD3 monoclonal antibody to induce immune regulation in type 1 diabetes.
Bisikirska BC, Herold KC. Bisikirska BC, et al. Ann N Y Acad Sci. 2004 Dec;1037:1-9. doi: 10.1196/annals.1337.001. Ann N Y Acad Sci. 2004. PMID: 15699486 Review. - Role of bone marrow stromal cells in the generation of human CD8+ regulatory T cells.
Poggi A, Zocchi MR. Poggi A, et al. Hum Immunol. 2008 Nov;69(11):755-9. doi: 10.1016/j.humimm.2008.08.278. Epub 2008 Sep 24. Hum Immunol. 2008. PMID: 18817823 Review.
Cited by
- Targeted delivery of immune therapeutics to lymph nodes prolongs cardiac allograft survival.
Bahmani B, Uehara M, Jiang L, Ordikhani F, Banouni N, Ichimura T, Solhjou Z, Furtmüller GJ, Brandacher G, Alvarez D, von Andrian UH, Uchimura K, Xu Q, Vohra I, Yilmam OA, Haik Y, Azzi J, Kasinath V, Bromberg JS, McGrath MM, Abdi R. Bahmani B, et al. J Clin Invest. 2018 Nov 1;128(11):4770-4786. doi: 10.1172/JCI120923. Epub 2018 Oct 2. J Clin Invest. 2018. PMID: 30277476 Free PMC article. - A novel trivalent non-Fc anti-CD3 Collabody preferentially induces Th1 cell apoptosis in vitro and long-lasting remission in recent-onset diabetic NOD mice.
Huang CC, Sung HH, Li HC, Miaw SC, Kung JT, Chou MY, Wu-Hsieh BA. Huang CC, et al. Front Immunol. 2023 Aug 3;14:1201853. doi: 10.3389/fimmu.2023.1201853. eCollection 2023. Front Immunol. 2023. PMID: 37600814 Free PMC article. - Inhibitory CD8+ T cells in autoimmune disease.
Suzuki M, Konya C, Goronzy JJ, Weyand CM. Suzuki M, et al. Hum Immunol. 2008 Nov;69(11):781-9. doi: 10.1016/j.humimm.2008.08.283. Epub 2008 Sep 21. Hum Immunol. 2008. PMID: 18812196 Free PMC article. Review. - CD8⁺ Treg cells associated with decreasing disease activity after intravenous methylprednisolone pulse therapy in lupus nephritis with heavy proteinuria.
Tsai YG, Lee CY, Lin TY, Lin CY. Tsai YG, et al. PLoS One. 2014 Jan 27;9(1):e81344. doi: 10.1371/journal.pone.0081344. eCollection 2014. PLoS One. 2014. PMID: 24475019 Free PMC article. - NOD2 regulates CXCR3-dependent CD8+ T cell accumulation in intestinal tissues with acute injury.
Wu X, Lahiri A, Haines GK 3rd, Flavell RA, Abraham C. Wu X, et al. J Immunol. 2014 Apr 1;192(7):3409-18. doi: 10.4049/jimmunol.1302436. Epub 2014 Mar 3. J Immunol. 2014. PMID: 24591373 Free PMC article.
References
- Xu D, et al. In vitro characterization of five humanized OKT3 effector function variant antibodies. Cell Immunol. 2000;200:16–26. - PubMed
- Carpenter PA, Tso JY, Press OW, Yu X, Anasetti C. Non-FcR-binding, humanized anti-CD3 antibody Hu291 induces apoptosis of human T cells more effectively than OKT3 and is immunosuppressive in vivo. Transplant. Proc. 2000;32:1545–1546. - PubMed
- Bolt S, et al. The generation of a humanized, non-mitogenic CD3 monoclonal antibody which retains in vitro immunosuppressive properties. Eur. J. Immunol. 1993;23:403–411. - PubMed
- Utset TO, et al. Modified anti-CD3 therapy in psoriatic arthritis: a phase I/II clinical trial. J. Rheumatol. 2002;29:1907–1913. - PubMed
Publication types
MeSH terms
Substances
Grants and funding
- M01 RR000645/RR/NCRR NIH HHS/United States
- DK063608/DK/NIDDK NIH HHS/United States
- RR00645/RR/NCRR NIH HHS/United States
- R01 DK057846/DK/NIDDK NIH HHS/United States
- DK57846/DK/NIDDK NIH HHS/United States
- AI-98-010/AI/NIAID NIH HHS/United States
- P30 DK063608/DK/NIDDK NIH HHS/United States
LinkOut - more resources
Full Text Sources
Other Literature Sources
Research Materials


