Amplification of tumor-specific regulatory T cells following therapeutic cancer vaccines - PubMed (original) (raw)
Comparative Study
Amplification of tumor-specific regulatory T cells following therapeutic cancer vaccines
Gang Zhou et al. Blood. 2006.
Abstract
The fate of tumor-specific CD4(+) T cells is central to the outcome of the host immune response to cancer. We show that tumor antigen recognition by a subset of CD4(+) T cells led to their differentiation into cells capable of suppressing naive and Th1 effector cells. Such tumor-induced regulatory T cells (TMTregs) arose both from precommitted "natural" regulatory T cells and CD4(+)CD25(-)GITR(low) precursors. Once induced, TMTregs were capable of maintaining suppressor activity long after transfer into antigen-free recipients. Suppression was mediated by GITR(high) cells residing within both CD25(+) and CD25(-) subsets. Vaccination of the tumor-bearing host concomitantly expanded TMTregs and effector cells, but suppression was dominant, blunting the expansion of naive tumor-specific T cells and blocking the execution of effector function in vitro and in vivo. These studies illustrate the possibility that therapeutic vaccination could actually worsen host tolerance to tumor antigens and support treatment paradigms that seek to not only increase the frequency of tumor-specific T cells, but to do so in conjunction with strategies that inactivate or remove regulatory T-cell populations.
Figures
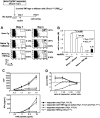
Figure 1.
Heterogeneity of tumor-specific CD4+ T cells. (A) A total of 2.5 × 10⁶ CFSE-labeled HA-specific CD4+Thy1.1+ T cells were transferred into BALB/c recipients (Thy1.2+/+) either tumor free (NT) or inoculated with 1 × 10⁶ A20HA 10 days earlier (TM). Sixteen days after T-cell transfer, some mice were immunized with vacHA and analyzed 5 days later. Mice were killed at indicated time points. The frequency of transferred Thy1.1+CD4+ cells in the spleen was measured by FACS analysis. Percentage of the gated population is displayed in each dot plot. CFSE profiles of the gated cells are shown. The percentage of the divided cells in the gated population is indicated in each histogram. (B) Absolute number of divided donor cells recovered from spleen (total splenocyte count × percent CD4+Thy1.1+ × percent donor cells that are CFSElow). For unvaccinated NT mice, only CFSEhigh donor cells were counted. Each group had a minimum of 3 mice. Results are shown as mean ± SE. (C) Cells were sorted based on cell division status as indicated in panel A. Sorted cells (2 × 10⁴) were stimulated with 10 μg/mL HA110-120 peptide in the presence of 2 × 10⁵ irradiated BALB/c splenocytes. Cell proliferation was measured by 3H-thymidine incorporation. Supernatants were analyzed by ELISA for detection of IL-2 and IFN-γ. (D) qRT-PCR analysis of sorted cells. Purified CD4+ T cells from 6.5 Tg mice were included as naive controls. Each symbol represents data from one mouse. Each sample was run in triplicate for each gene, with HPRT as internal reference. mRNA abundance of the target gene was normalized to HPRT and represented as relative mRNA frequency.
Figure 2.
Tumor antigen–experienced CD4+ T cells have regulatory function. (A) Suppression assay using purified CD4+ T cells from Rag2–/– 6.5 Tg mice as responders. Responder cells (2 × 10⁴/well) were mixed with sorted cells at the indicated ratios in the presence of 10 μg/mL HA peptide and 2 × 10⁵ irradiated BALB/c splenocytes. Proliferation of the culture in the absence of peptide was less than 1000 cpm. (B) Suppression of Th1 effector cells. Sorted effector cells and TMTregs (2 × 10⁴/well), either cultured alone or mixed together at a 1:1 ratio, were stimulated with HA peptide and irradiated BALB/c splenocytes. Cell proliferation and IFN-γ production were measured as described in Figure 1C. Results were shown as mean ± SE of triplicate cultures. The data shown are representative of 3 separate experiments with similar results.
Figure 3.
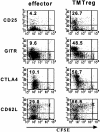
Phenotype of TMTregs. T-cell transfer and vaccination were conducted as described in Figure 1. Spleen cells from vaccinated tumor-free and TM mice were stained with anti-CD4, anti-Thy1.1, and the indicated mAb. Dot plots shown are gated on CD4+Thy1.1+ donor cell population. Value shown in each plot is the percentage of the indicated population. The data shown are representative of 3 separate experiments with similar results. GITR indicates glucocorticoid-induced TNF receptor.
Figure 4.
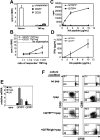
Tumor-induced CD4+ regulatory cells contain both CD25+ and CD25– cells, whereas antigen-specific suppression resides exclusively in a GITR+ subset. Spleen cells were pooled from vaccinated TM mice that had previously received CFSE-labeled Tg CD4+Thy1.1+ T cells as described in Figure 1. CFSElow cells were further separated into CD25+ and CD25– subsets. (A) Proliferation of CD25-separated and unseparated TMTregs. CFSElow effector cells from vaccinated NT mice were included for comparison. (B) In vitro suppression assay. Rag2–/– 6.5CD4+ responder T cells were mixed with CD25-separated TMTregs at the indicated ratios and assayed as in Figure 2A. (C) CFSE CD4+Thy1.1+ low cells from vaccinated TM mice were also sorted into GITRhigh and GITRlow subsets. GITR-fractionated cells were stimulated with irradiated fresh BALB/c splenocytes and varied concentration of HA peptide. Cell proliferation (C) and IFN-γ production (D) were measured as described in Figure 1C. (E) qRT-PCR analysis of GITR-fractionated cells. mRNA frequencies of the indicated genes were normalized to HPRT. (A-E) Results are shown as mean ± SE of triplicate cultures or reactions. (F) GITRhigh subset exclusively suppresses responder cells in vitro. Thy1.2+CD4+ responder cells from Rag2–/– 6.5 Tg mice were CFSE labeled and cultured with irradiated BALB/c (Thy1.1+/+ background) splenocytes and HA peptide, either alone or with equal number of GITR-fractionated cells (Thy1.1+/+). Three days later, cells were stained with anti-Thy1.2 and either anti-CD25 or anti-CD69 mAb. Plots shown are gated on Thy1.2+ responder cells. The data shown are representative of 2 separate experiments with similar results. Numbers indicate the percentage of cells in each quadrant.
Figure 5.
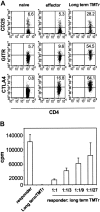
Tumor-specific regulatory cells maintain suppressor activity in the absence of antigen. CFSE-labeled Thy1.1+ TgCD4+ T cells were transferred into A20HA-bearing mice that were immunized with vacHA 2 weeks later. Thy1.1+CFSElow TMTregs were isolated after 5 days and transferred into NT BALB/c mice. Forty days after transfer, the recipient mice were challenged with vacHA and spleen cells were harvested 5 days later. (A) Surface staining of long-term TMTregs. Plots shown are gated on Thy1.1+ donor cells. Cells from NT mice that received naive TgCD4+ T cells without or with vaccination were included as naive or effector controls, respectively. The number in each plot indicates the percentage of positive cells in the gated population. (B) Thy1.1+ cells recovered from those described in panel A were sorted and stimulated with peptide-pulsed BALB/c splenocytes. Purified CD4+ T cells from Rag–/– 6.5 Tg mice were used as responders in the suppression assay. Results are shown as mean ± SE of triplicate cultures.
Figure 6.
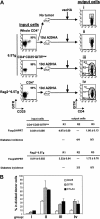
Induction of TMTregs in TM mice is independent of pre-existing natural Tregs. (A) Enriched CD4+ T cells (whole CD4+) from 6.5 Tg mice were labeled with CFSE and transferred into mice without tumor (group i) or with a 10-day A20HA tumor burden (group ii). Alternatively, sorted CD4+CD25– GITRlow cells from 6.5 Tg mice or CD4+ from Rag2–/– 6.5 Tg mice were labeled with CFSE and transferred into TM mice (groups iii and iv, respectively). An aliquot of the sorted donor cells was stained for expression of CD4, CD25, and GITR to evaluate their purity and RNA was isolated for qRT-PCR. Fourteen days after transfer, all recipients received vacHA, and responses were analyzed 5 days later. Spleen cells were stained for expression of CD4, TCR clonotype, and GITR. Plots shown were gated on divided donor cells. Cells were sorted based on the indicated gating regions (R1, R2, or R3). qRT-PCR analysis of Foxp3 mRNA was performed on sorted cells and the relative mRNA frequencies of Foxp3/HPRT are listed. The function of the sorted cells was tested by transferring them into Rag2–/– Ins-HA mice and monitoring diabetes development. Each mouse received either 50 000 cells sorted from the R2 region (CFSElow GITRlow), or cells from the R3 region (CFSElow GITR-unfractionated). Diabetes induction was monitored during a 30-day period. The incidence of diabetes is listed in Table 1. (B) Percentage of donor cells expressing CD25, GITR, and CTLA4 at the time of analysis as determined by FACS analysis. Each group had 3 mice. Results are shown as mean ± SE.
Figure 7.
TMTregs inhibit responder cell expansion and effector function but not Th1 differentiation. CD4+ T cells purified from 6.5 Tg mice (Thy1.1+/Thy1.2+) were labeled with CFSE and transferred as responder cells, either alone or together with an equal number of sorted TMTregs or effector cells (Thy1.1+/+), into BALB/c recipients. All mice received vacHA immunization the next day. (A) Cells from tail blood collected at the indicated time points were stained with anti-Thy1.1–PE and anti-Thy1.2–APC mAbs. Percentages of the gated populations are indicated. (B) Spleen cells were harvested, counted, and the absolute numbers of Thy1.1+/Thy1.2+ and Thy1.1+/+ cells were determined 5 days after vaccination. *P < .05; **P < .01. (C) The divided fractions of the Thy1.1+/Thy1.2+ and Thy1.1+/+ populations were sorted by FACS either separately or together and analyzed for proliferation and IFN-γ production in the presence of varied amounts of peptide. (D) In vitro suppression assay. Responder cells (Rag2–/– 6.5CD4+) were mixed with sorted cells at the indicated ratios in the presence of HA peptide and irradiated BALB/c splenocytes. The dotted line represents the proliferation of responders cultured alone with peptide and splenocytes; ▪, sorted responder cells when transferred alone; ▴, cotransferred responders and TMTregs sorted together; ×, separated responders when cotransferred with TMTregs; and □, separated TMTregs when cotransferred with responders. Results were shown as mean ± SE of triplicate cultures. The data shown are representative of 2 separate experiments. Similar results were obtained when TMTregs were transferred in excess of naive responder cells by a 2:1 ratio.
Similar articles
- Induction of antigen-specific immunologic tolerance by in vivo and in vitro antigen-specific expansion of naturally arising Foxp3+CD25+CD4+ regulatory T cells.
Nishimura E, Sakihama T, Setoguchi R, Tanaka K, Sakaguchi S. Nishimura E, et al. Int Immunol. 2004 Aug;16(8):1189-201. doi: 10.1093/intimm/dxh122. Epub 2004 Jul 5. Int Immunol. 2004. PMID: 15237110 - Blockade of TGF-β signaling to enhance the antitumor response is accompanied by dysregulation of the functional activity of CD4+CD25+Foxp3+ and CD4+CD25-Foxp3+ T cells.
Polanczyk MJ, Walker E, Haley D, Guerrouahen BS, Akporiaye ET. Polanczyk MJ, et al. J Transl Med. 2019 Jul 9;17(1):219. doi: 10.1186/s12967-019-1967-3. J Transl Med. 2019. PMID: 31288845 Free PMC article. - In-vitro generation and characterisation of murine CD4+CD25+ regulatory T cells with indirect allospecificity.
Tsang J, Jiang S, Tanriver Y, Leung E, Lombardi G, Lechler RI. Tsang J, et al. Int Immunopharmacol. 2006 Dec 20;6(13-14):1883-8. doi: 10.1016/j.intimp.2006.07.032. Epub 2006 Sep 1. Int Immunopharmacol. 2006. PMID: 17161341 - Thymic commitment of regulatory T cells is a pathway of TCR-dependent selection that isolates repertoires undergoing positive or negative selection.
Coutinho A, Caramalho I, Seixas E, Demengeot J. Coutinho A, et al. Curr Top Microbiol Immunol. 2005;293:43-71. doi: 10.1007/3-540-27702-1_3. Curr Top Microbiol Immunol. 2005. PMID: 15981475 Review. - Alloantigen specific T regulatory cells in transplant tolerance.
Hall BM, Tran G, Hodgkinson SJ. Hall BM, et al. Int Immunopharmacol. 2009 May;9(5):570-4. doi: 10.1016/j.intimp.2009.01.016. Epub 2009 Jan 29. Int Immunopharmacol. 2009. PMID: 19539571 Review.
Cited by
- Advancing non-small cell lung cancer treatment: the power of combination immunotherapies.
Wu Y, Yu G, Jin K, Qian J. Wu Y, et al. Front Immunol. 2024 Jul 2;15:1349502. doi: 10.3389/fimmu.2024.1349502. eCollection 2024. Front Immunol. 2024. PMID: 39015563 Free PMC article. Review. - A Winning New Combination? Toward Clinical Application in Oncology.
Maqsood Q, Sumrin A, Iqbal M, Hussain N, Mahnoor M, Zafar Saleem M, Perveen R. Maqsood Q, et al. Cancer Control. 2023 Jan-Dec;30:10732748231175240. doi: 10.1177/10732748231175240. Cancer Control. 2023. PMID: 37166227 Free PMC article. Review. - High glucose promotes regulatory T cell differentiation.
Pitmon E, Meehan EV, Ahmadi E, Adler AJ, Wang K. Pitmon E, et al. PLoS One. 2023 Feb 2;18(2):e0280916. doi: 10.1371/journal.pone.0280916. eCollection 2023. PLoS One. 2023. PMID: 36730267 Free PMC article. - Adoptive cell therapies in thoracic malignancies.
Lasvergnas J, Naigeon M, Chouahnia K, Zelek L, Chaput N, Duchemann B. Lasvergnas J, et al. Cancer Immunol Immunother. 2022 Sep;71(9):2077-2098. doi: 10.1007/s00262-022-03142-3. Epub 2022 Feb 7. Cancer Immunol Immunother. 2022. PMID: 35129636 Free PMC article. Review. - Multifaceted glycoadjuvant@AuNPs inhibits tumor metastasis through promoting T cell activation and remodeling tumor microenvironment.
Xu X, Gan M, Ge Y, Yi C, Feng T, Liu M, Wu C, Chen X, Zhang W, Zhao L, Zou J. Xu X, et al. J Nanobiotechnology. 2021 Nov 18;19(1):376. doi: 10.1186/s12951-021-01129-3. J Nanobiotechnology. 2021. PMID: 34794428 Free PMC article.
References
- Dunn GP, Old LJ, Schreiber RD. The immunobiology of cancer immunosurveillance and immunoediting. Immunity. 2004;21: 137-148. - PubMed
- Sotomayor EM, Borrello I, Levitsky HI. Tolerance and cancer: a critical issue in tumor immunology. Crit Rev Oncog. 1996;7: 433-456. - PubMed
- Sakaguchi S. Naturally arising CD4+ regulatory t cells for immunologic self-tolerance and negative control of immune responses. Annu Rev Immunol. 2004;22: 531-562. - PubMed
- Shevach EM. Regulatory T cells in autoimmmunity*. Annu Rev Immunol. 2000;18: 423-449. - PubMed
- Maloy KJ, Powrie F. Regulatory T cells in the control of immune pathology. Nat Immunol. 2001;2: 816-822. - PubMed
Publication types
MeSH terms
Substances
LinkOut - more resources
Full Text Sources
Other Literature Sources
Research Materials


