Developmental regulation of a proinsulin messenger RNA generated by intron retention - PubMed (original) (raw)
Developmental regulation of a proinsulin messenger RNA generated by intron retention
Alicia Mansilla et al. EMBO Rep. 2005 Dec.
Abstract
Proinsulin gene expression regulation and function during early embryonic development differ remarkably from those found in postnatal organisms. The embryonic proinsulin protein content decreased from gastrulation to neurulation in contrast with the overall proinsulin messenger RNA increase. This is due to increasing levels of a proinsulin mRNA variant generated by intron 1 retention in the 5' untranslated region. Inclusion of intron 1 inhibited proinsulin translation almost completely without affecting nuclear export or cytoplasmic decay. The novel proinsulin mRNA isoform expression was developmentally regulated and tissue specific. The proportion of intron retention increased from gastrulation to organogenesis, was highest in the heart tube and presomitic region, and could not be detected in the pancreas. Notably, proinsulin addition induced cardiac marker gene expression in the early embryonic stages when the translationally active transcript was expressed. We propose that regulated unproductive splicing and translation is a mechanism that regulates proinsulin expression in accordance with specific requirements in developing vertebrates.
Figures
Figure 1
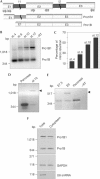
Embryonic proinsulin protein and messenger RNA content. (A) Proinsulin was measured in extracts of pools of 18 embryos of stage (st.) 4 (12–18 h of incubation) and st. 10 (≈36 h) by radioimmunoassay (RIA), and is expressed relative to total protein concentration. Results represent the mean±s.d. of two replicates. Note that chick proinsulin protein levels might be underestimated as a rat insulin/proinsulin RIA kit was used. (B) Quantitative reverse transcription–PCR of RNA from st. 4 and st. 10 embryos, with primers P1 and P2 (indicated in Fig 2A) for the proinsulin coding region shared by the two embryonic transcripts. The levels of proinsulin mRNA were normalized by glyceraldehyde-3-phosphate dehydrogenase (GAPDH) mRNA levels. Results represent the mean ±s.d. of two experiments each in duplicate.
Figure 2
Characterization of embryonic proinsulin transcripts. (A) Schematic organization of the chicken proinsulin gene and embryonic transcripts: exons (E), introns (I) and primers (P) used in PCR are indicated. The intron 1 sequence is provided in the supplementary information online. (B,C). Proinsulin transcript expression during chick early development. Proinsulin intron 1 retention was assayed by reverse transcription–PCR (RT–PCR) with P3 and P5 primers, followed by Southern blot analysis. Percentage of intron retention was calculated as ((mRNA retaining intron 1)/(mRNA retaining intron 1+mRNA with intron 1 processed) × 100]. (D) RT–PCR with P4 and P5 primers of RNA from the pancreas of embryonic day 13 (E13) and stage (st.) 10 embryos. (E) Mouse proinsulin transcript expression. RT–PCR of E7.5 or E9 mouse embryo RNA and of adult mouse pancreatic RNA. (F) Proinsulin RT–PCR of total and cytoplasmic RNA from st. 10 embryos. Glyceraldehyde-3-phosphate dehydrogenase (GAPDH) amplification was carried out as RNA input and general splicing control. U6 small nuclear RNA (snRNA) amplification was carried out as nuclear contamination control; RT, control without reverse transcriptase. Products in (B) and (E) were cloned and sequenced to confirm that they corresponded to the spliced and intron 1-retained proinsulin transcripts.
Figure 3
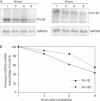
Stability of proinsulin embryonic messenger RNA. (A) Northern blot of NIH3T3 cells transfected with spliced-out (Pro1B) or intron-retained embryonic capped mRNA (Pro1B1). (B) Decay curves. RNA was extracted at the times indicated and equal amounts of RNA were subjected to northern blot analysis. Pro1B and Pro1B1 mRNA levels were corrected by glyceraldehyde-3-phosphate dehydrogenase (GAPDH) mRNA levels.
Figure 4
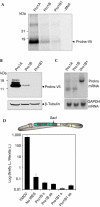
Translational activity of proinsulin transcripts. (A) In vitro translation of pancreatic (Pro1A), embryonic spliced-out (Pro1B) and intron-retained (Pro1B1) proinsulin-V5 transcripts. The amount of proinsulin generated by Pro1B1 messenger RNA was 2.5-fold lower than that generated by Pro1B mRNA. (B) Proinsulin expression in transfected NIH3T3 cells. Proinsulin expression was analysed by immunoblot using an anti-V5 tag antibody. β-Tubulin was used as a loading control. (C) Northern blot of transfected NIH3T3 cells. Membranes were probed for proinsulin and glyceraldehyde-3-phosphate dehydrogenase (GAPDH) mRNA. Proinsulin mRNA level normalized by GAPDH mRNA was 2.64 for Pro1A, 2.72 for Pro1B and 6.58 for Pro1B1. (D) Assessment of internal ribosome entry site (IRES) activity. Diagram of the bicistronic reporter construct (upper drawing). The _Sac_I cloning site in the intercistronic region is indicated. IRES activity is calculated as firefly luciferase activity/Renilla luciferase activity. Results represent the mean±s.d. of three replicates.
Figure 5
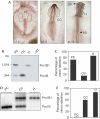
Modulation of the proinsulin splicing pattern. (A) Diagram of embryonic regions. (B,C) Proinsulin reverse transcription–PCR (RT—PCR) with P3 and P5 primers followed by Southern blot of RNA from different regions of stage (st.) 10 embryos. (D,E) RT–PCR with P3 and P5 primers followed by Southern blot of cardiac regions during cardiac morphogenesis. Part (D) includes three distinct embryonic RNA pools. CC, cardiac crescents; H, heart; OV, optic vesicle; PC, precardiac region; PS, presomitic region. Percentage of intron retention is calculated as in Fig 1. Results represent mean percentage±s.e.m. of intron retention from three independent experiments.
Figure 6
Proinsulin effect on cardiac expression markers. (A) Diagram of proinsulin bead (asterisk) implanted on one side at the lateral limit of the precardiac region in stage (st.) 5 embryos. Embryos at st. 10 (B,D,E) and st. 11 (C,F) treated with a proinsulin-coated bead, in a solution of 600 ng/ml (B,E) or 15 μg/ml (C,D,F) are shown. In situ hybridization of VMHC1 (B,C) and Shh (E). Immunohistochemistry for MF20 (D). In situ hybridization for paraxis followed by immunohistochemistry for MF20 (F). Ectopic tissue in the ventral face of the bead (arrowhead) located between the bead (asterisk) and the heart tube expressed VMHC1 (B,C) and MF20 (D,F). No labelling was detectable around the bead for Shh (E) or paraxis (F). Insets in parts (C,D) correspond to heart level transversal sections. H, heart; N, neural tube. Scale bar, 120 μm.
Similar articles
- Proinsulin in development: New roles for an ancient prohormone.
Hernández-Sánchez C, Mansilla A, de la Rosa EJ, de Pablo F. Hernández-Sánchez C, et al. Diabetologia. 2006 Jun;49(6):1142-50. doi: 10.1007/s00125-006-0232-5. Epub 2006 Apr 5. Diabetologia. 2006. PMID: 16596360 Review. - Developmentally regulated expression of the preproinsulin gene in the chicken embryo during gastrulation and neurulation.
Pérez-Villamil B, de la Rosa EJ, Morales AV, de Pablo F. Pérez-Villamil B, et al. Endocrinology. 1994 Dec;135(6):2342-50. doi: 10.1210/endo.135.6.7988416. Endocrinology. 1994. PMID: 7988416 - Alternative splicing variants of proinsulin mRNA and the effects of excess proinsulin on cardiac morphogenesis.
Martínez-Campos E, Hernández-SanMiguel E, López-Sánchez C, De Pablo F, Hernández-Sánchez C. Martínez-Campos E, et al. FEBS Lett. 2013 Jul 11;587(14):2272-7. doi: 10.1016/j.febslet.2013.05.060. Epub 2013 Jun 6. FEBS Lett. 2013. PMID: 23747309 - Optimal antisense target reducing INS intron 1 retention is adjacent to a parallel G quadruplex.
Kralovicova J, Lages A, Patel A, Dhir A, Buratti E, Searle M, Vorechovsky I. Kralovicova J, et al. Nucleic Acids Res. 2014 Jul;42(12):8161-73. doi: 10.1093/nar/gku507. Epub 2014 Jun 17. Nucleic Acids Res. 2014. PMID: 24944197 Free PMC article. - (Pro)insulin and insulin-like growth factor I complementary expression and roles in early development.
Alarcón C, Morales AV, Pimentel B, Serna J, de Pablo F. Alarcón C, et al. Comp Biochem Physiol B Biochem Mol Biol. 1998 Sep;121(1):13-7. doi: 10.1016/s0305-0491(98)10105-0. Comp Biochem Physiol B Biochem Mol Biol. 1998. PMID: 9972280 Review.
Cited by
- Unconstrained mining of transcript data reveals increased alternative splicing complexity in the human transcriptome.
Mollet IG, Ben-Dov C, Felício-Silva D, Grosso AR, Eleutério P, Alves R, Staller R, Silva TS, Carmo-Fonseca M. Mollet IG, et al. Nucleic Acids Res. 2010 Aug;38(14):4740-54. doi: 10.1093/nar/gkq197. Epub 2010 Apr 12. Nucleic Acids Res. 2010. PMID: 20385588 Free PMC article. - Proinsulin in development: New roles for an ancient prohormone.
Hernández-Sánchez C, Mansilla A, de la Rosa EJ, de Pablo F. Hernández-Sánchez C, et al. Diabetologia. 2006 Jun;49(6):1142-50. doi: 10.1007/s00125-006-0232-5. Epub 2006 Apr 5. Diabetologia. 2006. PMID: 16596360 Review. - Medicago truncatula contains a second gene encoding a plastid located glutamine synthetase exclusively expressed in developing seeds.
Seabra AR, Vieira CP, Cullimore JV, Carvalho HG. Seabra AR, et al. BMC Plant Biol. 2010 Aug 19;10:183. doi: 10.1186/1471-2229-10-183. BMC Plant Biol. 2010. PMID: 20723225 Free PMC article. - Genome-wide analysis of alternative splicing during human heart development.
Wang H, Chen Y, Li X, Chen G, Zhong L, Chen G, Liao Y, Liao W, Bin J. Wang H, et al. Sci Rep. 2016 Oct 18;6:35520. doi: 10.1038/srep35520. Sci Rep. 2016. PMID: 27752099 Free PMC article. - Selected imprinting of INS in the marsupial.
Stringer JM, Suzuki S, Pask AJ, Shaw G, Renfree MB. Stringer JM, et al. Epigenetics Chromatin. 2012 Aug 28;5(1):14. doi: 10.1186/1756-8935-5-14. Epigenetics Chromatin. 2012. PMID: 22929229 Free PMC article.
References
- Black DL (2003) Mechanisms of alternative pre-messenger RNA splicing. Annu Rev Biochem 72: 291–336 - PubMed
- Diaz B, Serna J, De Pablo F, de la Rosa EJ (2000) In vivo regulation of cell death by embryonic (pro)insulin and the insulin receptor during early retinal neurogenesis. Development 127: 1641–1649 - PubMed
- Dreyfuss G, Kim VN, Kataoka N (2002) Messenger-RNA-binding proteins and the messages they carry. Nat Rev Mol Cell Biol 3: 195–205 - PubMed
Publication types
MeSH terms
Substances
LinkOut - more resources
Full Text Sources


