Phylogenetic analysis of eIF4E-family members - PubMed (original) (raw)
Phylogenetic analysis of eIF4E-family members
Bhavesh Joshi et al. BMC Evol Biol. 2005.
Abstract
Background: Translation initiation in eukaryotes involves the recruitment of mRNA to the ribosome which is controlled by the translation factor eIF4E. eIF4E binds to the 5'-m7Gppp cap-structure of mRNA. Three dimensional structures of eIF4Es bound to cap-analogues resemble 'cupped-hands' in which the cap-structure is sandwiched between two conserved Trp residues (Trp-56 and Trp-102 of H. sapiens eIF4E). A third conserved Trp residue (Trp-166 of H. sapiens eIF4E) recognizes the 7-methyl moiety of the cap-structure. Assessment of GenBank NR and dbEST databases reveals that many organisms encode a number of proteins with homology to eIF4E. Little is understood about the relationships of these structurally related proteins to each other.
Results: By combining sequence data deposited in the Genbank databases, we have identified sequences encoding 411 eIF4E-family members from 230 species. These sequences have been deposited into an internet-accessible database designed for sequence comparisons of eIF4E-family members. Most members can be grouped into one of three classes. Class I members carry Trp residues equivalent to Trp-43 and Trp-56 of H. sapiens eIF4E and appear to be present in all eukaryotes. Class II members, possess Trp-->Tyr/Phe/Leu and Trp-->Tyr/Phe substitutions relative to Trp-43 and Trp-56 of H. sapiens eIF4E, and can be identified in Metazoa, Viridiplantae, and Fungi. Class III members possess a Trp residue equivalent to Trp-43 of H. sapiens eIF4E but carry a Trp-->Cys/Tyr substitution relative to Trp-56 of H. sapiens eIF4E, and can be identified in Coelomata and Cnidaria. Some eIF4E-family members from Protista show extension or compaction relative to prototypical eIF4E-family members.
Conclusion: The expansion of sequenced cDNAs and genomic DNAs from all eukaryotic kingdoms has revealed a variety of proteins related in structure to eIF4E. Evolutionarily it seems that a single early eIF4E gene has undergone multiple gene duplications generating multiple structural classes, such that it is no longer possible to predict function from the primary amino acid sequence of an eIF4E-family member. The variety of eIF4E-family members provides a source of alternatives on the eIF4E structural theme that will benefit structure/function analyses and therapeutic drug design.
Figures
Figure 1
An alignment of the amino acid sequences of selected established eIF4E-family members. An alignment of the complete amino acid sequences of H. sapiens eIF4E-1, M. musculus eIF4E-1, X. laevis eIF4E-1A, D. rerio eIF4E-1A, D. melanogaster eIF4E-1a, T. aestivum eIF4E and eIF(iso)4E, S. pombe eIF4E1, and S. cerevisiae eIF4E. eIF4E-family members with names in blue indicate that the sequence was estimated or verified using genomic sequence data. A sequence of identity is shown with aromatic residues boxed in red. Black and grey shading: conserved amino acids identical in all or similar in greater than 75 % of the sequences shown, respectively. Yellow shading: His-residues that border the conserved core region of an eIF4E-family member. Blue shading: regions of the respective eIF4E-family member that have been shown to be dispensable for eIF4E-function in vitro. Residues in green: positions of residues equivalent to Trp-56, Trp-102, Glu-103 and Trp-166 of H. sapiens and M. musculus eIF4E-1 that directly interact with the cap-structure. Residues in purple: identity with respect to residues Val-69 and Trp-73 of M. musculus eIF4E-1 that interact with eIF4G and 4E-BPs and are found within a region of eIF4E-family members possessing the concensus (S/T)VxxFW (as indicated). Numbers to the right of the sequences indicate the positions of residues from the N-terminal Met.
Figure 2
A radial cladogram describing the overall relationship of selected eIF4E-family members from multiple species. The topology of a neighbor-joining tree visualized in radial format derived from an alignment of nucleotide sequences representing the conserved core regions of the indicated eIF4E-family members. The full names of the species represented and the accession numbers for cDNA sequences used to derive consensus core sequences can be found within supplementary data to this publication. Alignments of cDNA sequences to derive consensus core sequences can be obtained and verified at the "eIF4E-family member database" [35]. eIF4E-family member names in black or red indicate whether or not the complete sequence of the conserved core region of the member could be predicted from consensus cDNA sequence data, respectively. eIF4E-family member names in blue indicate that genomic sequence data was used to either verify or determine the nucleotide sequence representing the core region of the member. The shape of a 'leaf' indicates the taxonomic kingdom from which the species containing the eIF4E-family member derives: Metazoa (diamonds); Fungi (squares); Viridiplantae (triangles); and Protista (circles); respectively. The color of a 'leaf' indicates the sub-group of the eIF4E-family member: metazoan eIF4E-1 and IFE-3-like (red); fungal eIF4E-like (gold); plant eIF4E and eIF(iso)4E-like (green); metazoan eIF4E-2-like (cyan); plant nCBP-like (blue); fungal nCBP/eIF4E-2-like (purple); metazoan eIF4E-3-like (pink); atypical eIF4E-family members from some protists(white). eIF4E-family members within structural classes Class I, Class II, and Class III are indicated. Bootstrap values of greater than 60 % derived from 50,000 tests are shown.
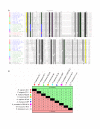
Figure 3
Comparison of the conserved cores of eIF4E-family members from different taxonomic sub-groups. A. An alignment of amino acid sequences representing the conserved core regions of the indicated eIF4E-family members. Sequence names are highlighted to indicate structural class: Class I in blue; Class II in green; and Class III in red. Atypical eIF4E-family members that could not be accurately classified based on similarity to other structural class members are shown with sequences names in black. Symbols to the left indicate the taxonomic sub-group of the eIF-4E-family member (as described in the legend to Figure 2). Residues highlighted within the amino acid alignment represent: identity with respect to residues Trp-43, Trp-56, Trp-102, Glu-103, and Trp-166 within H. sapiens eIF4E-1 (green); identity within the conserved (S/T)VxxFW consensus region containing amino acids equivalent to Val-69 and Trp-73 of H. sapiens eIF4E-1(purple); identity with His-residues equivalent to those that border the core region of H. sapiens eIF4E-1 (shaded in yellow). Variations at residues equivalent to Trp-43 and Trp-56 of H. sapiens eIF4E-1 are indicated as follows: Tyr/Phe-shaded in blue with white text; Cys-shaded in red with white text. Residues shaded in black or grey within the alignment indicate amino acids that are identical in all sequences or similar in greater than 85% of the sequences, respectively. Numbers to the right of the alignment represent distances of amino acids with respect to the predicted N-terminal Met residue. B. Identities and similarities (based on a PAM 250 matrix [58]) between the amino acid sequences representing the core regions of selected eIF4E-family members from each of the eight sub-groups.
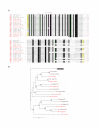
Figure 4
Comparison of the conserved core regions of selected Class I eIF4E-family members from Viridiplantae. A. An alignment of the amino acid sequences representing the 'core' regions of Class I eIF4E-family members from the indicated species of Viridiplantae and of eIF4E-1 from H. sapiens. Amino acid residues within the alignment are highlighted as described in the legend to
Figure 3A
with the exception that residues shaded in grey indicate similar amino acids in more than 90% of the sequences shown. Numbers to the right of the alignment represent distances of amino acids with respect to the N-terminal Met residue (black) or, for eIF4E-family members for which the N-terminal Met could not be predicted, from the first residue shown (red). B. A phylogram constructed by neighbor-joining derived from alignments of nucleotide sequences representing the core regions of the indicated Class I-family members. Bootstrap values greater than 70% derived from 50,000 tests are shown to indicate supported nodes. For A and B: names of eIF4E-family members are highlighted to indicate taxonomic divisions: Eudicotyledons (blue), Liliopsida (green), Bryopsida (purple), Coniferopsida (red), Stem Magnoliophyta (cyan), Magnoliids (orange), Chlorophyceae (black), Mammalia (white on black). Names of family members and residues shaded in cyan indicate evidence that a gene-duplication occurred prior to speciation.
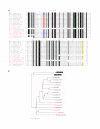
Figure 5
Comparison of the conserved core regions of selected Class I eIF4E-family members from Metazoa. A. An alignment of the amino acid sequences representing the 'core' regions of Class I eIF4E-family members from the indicated species of Metazoa. Amino acid residues within the alignment are highlighted as described in the legend to
Figure 3A
with the exception that residues shaded in grey indicate similar amino acids in more than 95% of the sequences shown. Numbers to the right of the alignment represent distances of amino acids with respect to the N-terminal Met residue (black) or, for eIF4E-family members for which the N-terminal Met could not be predicted, from the first residue shown (red). B. A phylogram constructed by neighbor-joining derived from alignments of nucleotide sequences representing the core regions of the indicated Class I-family members. Bootstrap values greater than 70% derived from 50,000 tests are shown to indicate supported nodes. For A and B: names of eIF4E-family members highlighted in blue indicate that genomic sequence from the indicated species was employed to verify and predict the amino acid sequence of the eIF4E-family member.
Figure 6
Comparison of the conserved core regions of Class I eIF4E-family members from species of Nematoda. A. An alignment of amino acid sequences representing the conserved core regions of Class I eIF4E-family members from the species of Nematoda indicated and of H. sapiens eIF4E-1. Amino acid residues within the alignment are highlighted as described in the legend to
Figure 3A
with the following exceptions: residues shaded in black indicate amino acids identical in all eIF4E-family members with respect to regions that could be predicted; residues shaded in grey indicate amino acids identical in all eIF4E-family members from nematoda with respect to regions that could be predicted that differ from equivalent residues in H. sapiens eIF4E-1. Numbers to the right of the alignment represent distances of amino acids with respect to the N-terminal Met residue (black) or, for eIF4E-family members for which the N-terminal Met could not be predicted, from the first residue shown (red). B. A phylogram constructed by neighbor-joining derived from an alignment of nucleotide sequences representing the conserved core regions of the eIF4E-family members indicated. Bootstrap values greater than 70% derived from 50,000 tests are shown to indicate supported nodes. For A and B: names of eIF4E-family members in red indicate that only a portion of the conserved core region could be predicted.
Figure 7
Comparison of the conserved core regions of selected Class II eIF4E-family members. A. An alignment of amino acid sequences representing the conserved core regions of the Class II eIF4E-family members from the taxonomic species indicated and of H. sapiens eIF4E-1. Amino acid residues within the alignment are highlighted as described in the legend to
Figure 3A
with the exception that residues shaded in grey indicate identical amino acids in greater than 84% of the sequences shown. Numbers to the right of the alignment represent distances of amino acids with respect to the N-terminal Met residue (black) or, for eIF4E-family members for which the N-terminal Met could not be predicted, from the first residue shown (red). B. A phylogram constructed by neighbor-joining derived from an alignment of nucleotide sequences representing the conserved core regions of the eIF4E-family members indicated. Bootstrap values greater than 70% derived from 50,000 tests are shown to indicate supported nodes. For A and B: names of eIF4E-family members in red indicate that only a portion of the conserved core region could be predicted.
Figure 8
Comparison of the conserved core regions of selected Class III eIF4E-family members. A. An alignment of amino acid sequences representing the conserved core regions of the Class III eIF4E-family members from the taxonomic species indicated and of H. sapiens eIF4E-1. Amino acid residues within the alignment are highlighted as described in the legend to
Figure 3A
. Numbers to the right of the alignment represent distances of amino acids with respect to the N-terminal Met residue (black) or, for eIF4E-family members for which the N-terminal Met could not be predicted, from the first residue shown (red). B. A phylogram constructed by neighbor-joining derived from an alignment of nucleotide sequences representing the conserved core regions of the eIF4E-family members indicated. Bootstrap values greater than 70% derived from 50,000 tests are shown to indicate supported nodes. For A and B: names of eIF4E-family members in red indicate that only a portion of the conserved core region could be predicted.
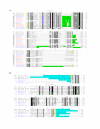
Figure 9
eIF4E-family members from some species of Protista show extension or compaction. A. An alignment of amino acid sequences representing the conserved core regions of eIF4E-family members from Alveolata, Stramenopiles, the Haptophyceae E. huxleyi and of H. sapiens eIF4E-1, and M. musculus eIF4E-2A and eIF4E-3. Green boxes indicate amino acids extensions relative to Class I, II, or III eIF4E-family members from other species. B. An alignment of the complete predicted amino acid sequences of predicted eIF4E-family members from C. merolae, G. theta nucleomorph, and E. cuniculi, and from H. sapiens eIF4E-1, and M. musculus eIF4E-2A and eIF4E-3. Residues shaded in light blue indicate regions N- and C- terminal to the conserved core of the respective eIF4E-family member. Residues shaded in greenindicate variations at positions equivalent to Val-69 and Trp-73 of H. sapiens eIF4E-1. For both A and B: amino acid residues within the alignment are highlighted as described in the legend to
Figure 3A
with the exception that residues shaded in grey indicate amino acids similar in greater than 80% (A) or 70% (B) of the sequences shown. Numbers to the right of the alignments represent distances of amino acids with respect to the N-terminal Met residue (black) or, for eIF4E-family members for which the N-terminal Met could not be predicted, from the first residue shown (red). eIF4E-family members for which names are shown in red indicate that only a portion of the core region for that member could be estimated. eIF4E-family members for which names are shown in blue indicate that sequences were predicted using genomic sequence data.
Similar articles
- Two zebrafish eIF4E family members are differentially expressed and functionally divergent.
Robalino J, Joshi B, Fahrenkrug SC, Jagus R. Robalino J, et al. J Biol Chem. 2004 Mar 12;279(11):10532-41. doi: 10.1074/jbc.M313688200. Epub 2003 Dec 29. J Biol Chem. 2004. PMID: 14701818 - Structures of the human eIF4E homologous protein, h4EHP, in its m7GTP-bound and unliganded forms.
Rosettani P, Knapp S, Vismara MG, Rusconi L, Cameron AD. Rosettani P, et al. J Mol Biol. 2007 May 4;368(3):691-705. doi: 10.1016/j.jmb.2007.02.019. Epub 2007 Feb 20. J Mol Biol. 2007. PMID: 17368478 - Analysis of eIF4E-family members in fungi contributes to their classification in eukaryotes.
Hernández G, Ross-Kaschitza D, Moreno-Hagelsieb G, García A, Vélez DE, Torres BL. Hernández G, et al. J Biol Chem. 2025 Feb;301(2):108129. doi: 10.1016/j.jbc.2024.108129. Epub 2024 Dec 21. J Biol Chem. 2025. PMID: 39716494 Free PMC article. - eIF4E and Interactors from Unicellular Eukaryotes.
Ross-Kaschitza D, Altmann M. Ross-Kaschitza D, et al. Int J Mol Sci. 2020 Mar 21;21(6):2170. doi: 10.3390/ijms21062170. Int J Mol Sci. 2020. PMID: 32245232 Free PMC article. Review. - Taking a re-look at cap-binding signatures of the mRNA cap-binding protein eIF4E orthologues in trypanosomatids.
Das S. Das S. Mol Cell Biochem. 2021 Feb;476(2):1037-1049. doi: 10.1007/s11010-020-03970-w. Epub 2020 Nov 10. Mol Cell Biochem. 2021. PMID: 33169189 Review.
Cited by
- On the Diversification of the Translation Apparatus across Eukaryotes.
Hernández G, Proud CG, Preiss T, Parsyan A. Hernández G, et al. Comp Funct Genomics. 2012;2012:256848. doi: 10.1155/2012/256848. Epub 2012 May 14. Comp Funct Genomics. 2012. PMID: 22666084 Free PMC article. - eIF4E1b is a non-canonical eIF4E protecting maternal dormant mRNAs.
Lorenzo-Orts L, Strobl M, Steinmetz B, Leesch F, Pribitzer C, Roehsner J, Schutzbier M, Dürnberger G, Pauli A. Lorenzo-Orts L, et al. EMBO Rep. 2024 Jan;25(1):404-427. doi: 10.1038/s44319-023-00006-4. Epub 2023 Dec 14. EMBO Rep. 2024. PMID: 38177902 Free PMC article. - The Distribution of eIF4E-Family Members across Insecta.
Tettweiler G, Kowanda M, Lasko P, Sonenberg N, Hernández G. Tettweiler G, et al. Comp Funct Genomics. 2012;2012:960420. doi: 10.1155/2012/960420. Epub 2012 Jun 13. Comp Funct Genomics. 2012. PMID: 22745595 Free PMC article. - Anomalous HIV-1 RNA, How Cap-Methylation Segregates Viral Transcripts by Form and Function.
Boris-Lawrie K, Singh G, Osmer PS, Zucko D, Staller S, Heng X. Boris-Lawrie K, et al. Viruses. 2022 Apr 29;14(5):935. doi: 10.3390/v14050935. Viruses. 2022. PMID: 35632676 Free PMC article. Review. - Characterization of an Atypical eIF4E Ortholog in Leishmania, LeishIF4E-6.
Tupperwar N, Shrivastava R, Baron N, Korchev O, Dahan I, Shapira M. Tupperwar N, et al. Int J Mol Sci. 2021 Nov 24;22(23):12720. doi: 10.3390/ijms222312720. Int J Mol Sci. 2021. PMID: 34884522 Free PMC article.
References
- Hershey JWB, Merrick WC. Pathway and mechanism of initiation of protein synthesis. In: Sonenberg N, Hershey JWB, Mathews MB, editor. Translational control of gene expression. Cold Spring Harbor Laboratory Press: Cold Spring Harbor, NY; 2000. pp. 33–88.
Publication types
MeSH terms
Substances
LinkOut - more resources
Full Text Sources
Other Literature Sources
Molecular Biology Databases
Miscellaneous


