Phospho-dependent binding of the clathrin AP2 adaptor complex to GABAA receptors regulates the efficacy of inhibitory synaptic transmission - PubMed (original) (raw)
Comparative Study
. 2005 Oct 11;102(41):14871-6.
doi: 10.1073/pnas.0506653102. Epub 2005 Sep 28.
Affiliations
- PMID: 16192353
- PMCID: PMC1253579
- DOI: 10.1073/pnas.0506653102
Comparative Study
Phospho-dependent binding of the clathrin AP2 adaptor complex to GABAA receptors regulates the efficacy of inhibitory synaptic transmission
Josef T Kittler et al. Proc Natl Acad Sci U S A. 2005.
Abstract
The efficacy of synaptic inhibition depends on the number of gamma-aminobutyric acid type A receptors (GABA(A)Rs) expressed on the cell surface of neurons. The clathrin adaptor protein 2 (AP2) complex is a critical regulator of GABA(A)R endocytosis and, hence, surface receptor number. Here, we identify a previously uncharacterized atypical AP2 binding motif conserved within the intracellular domains of all GABA(A)R beta subunit isoforms. This AP2 binding motif (KTHLRRRSSQLK in the beta3 subunit) incorporates the major sites of serine phosphorylation within receptor beta subunits, and phosphorylation within this site inhibits AP2 binding. Furthermore, by using surface plasmon resonance, we establish that a peptide (pepbeta3) corresponding to the AP2 binding motif in the GABA(A)R beta3 subunit binds to AP2 with high affinity only when dephosphorylated. Moreover, the pepbeta3 peptide, but not its phosphorylated equivalent (pepbeta3-phos), enhanced the amplitude of miniature inhibitory synaptic current and whole cell GABA(A)R current. These effects of pepbeta3 on GABA(A)R current were occluded by inhibitors of dynamin-dependent endocytosis supporting an action of pepbeta3 on GABA(A)R endocytosis. Therefore phospho-dependent regulation of AP2 binding to GABA(A)Rs provides a mechanism to specify receptor cell surface number and the efficacy of inhibitory synaptic transmission.
Figures
Fig. 1.
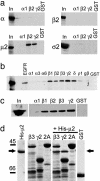
Identification of a direct interaction between GABAAR ICDs and the μ2 subunit of the AP2 adaptor complex. (a) GABAAR ICDs interact with the μ2 subunit of AP2. 35S-labeled α, β2-, μ2-, and σ2 adaptins were synthesized by coupled transcription translation in vitro and incubated with GST-α1, GST-β2 and GST-γ2 GABAAR ICDs, or GST alone. Bound material was separated by SDS/PAGE and visualized by autoradiography. Input (In) represents 10% of total amount of radiolabeled protein added to assay. (b) Further analysis of GABAAR subunit specificity of μ2 binding. μ2 adaptin was synthesized as above and exposed to various GABAAR ICDs, and bound material was separated by SDS/PAGE and visualized by autoradiography. In represents 10% of total amount of radiolabeled protein added to assay. EGFR and GST are positive and negative controls for μ2 binding, respectively. (c) GABAAR ICDs bind μ2 from brain extract. GABAAR ICDs immobilized on glutathione agarose beads were incubated with solubilized brain extracts. Bound material was resolved by SDS/PAGE and analyzed by Western blotting with antibodies to μ2. In represents 25% of the material used for each experiment. (d) Direct binding of purified bacterially expressed His-tagged μ2 (residues 156-435) to GABAAR GST-β3 and GST-γ2 ICD but not to either GST-Synaptotagmin 1 C2A (2A) domain or GST alone. GST fusion proteins were exposed to His-μ2, and complexes were resolved by SDS/PAGE, followed by staining the gel with Coomassie brilliant blue. His-μ2 represents purified His-μ2 alone. β3, γ2, and 2A represent GST-β3, GST-γ2, or GST-synaptotagmin 2A (2A) domain resolved on the gel either alone to show fusion protein bands or after exposure to His-μ2. The arrow denotes bound His-μ2 detected by Coomassie staining.
Fig. 2.
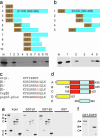
Identification of the μ2 binding domain on GABAAR β subunits and GABAAR β subunit-binding domain within μ2. (_a_-c) Identification of the μ2 binding site in GABAAR β subunits. GST fusion protein deletion constructs of GABAAR β1 ICD (a) and β3 ICD (b) were tested for binding to 35S-labeled μ2. Bound material was separated by SDS/PAGE and visualized by autoradiography. (a) The different GST-β1 ICD deletion constructs are represented in Upper. Lanes: 1, GST; 2, GST-β1 whole ICD residues 302-425; 3, GST-β1 residues 302-365; 4, GST-β1 residues 302-332; 5, GST-β1 residues 333-365; 6, GST-β1 residues 333-395; 7, GST-β1 366-425 residues; 8, GST-β1 residues 366-395; 9, GST-β1 residues 365-404; 10, GST-β1 residues 366-415. Binding of these constructs to 35S μ2 shown in Lower.(b) The different GST-β3 ICD deletion constructs are represented in Upper. Lanes: 1, GST-β3 whole ICD residues 302-426; 2, GST-β3 residues 366-426; 3, GST-β3 residues 366-395; 4, GST-β3 residues 395-426; 5, GST-β3 residues 345-408. Binding of these constructs to 35S μ2 is shown in Lower. (c) Alignment showing the identified μ2 binding domain in GABAAR β subunits and homology to the μ2 binding motif of synaptotagmin, and the sequence of β3 peptides (pepβ3 and pepβ3-phos) used in later experiments. Note also that conserved serine phosphorylation sites in GABAAR β subunit (S408 in β1, S410 in β2, and S408/S409 in β3) S408/S409 in pepβ3-phos are marked in red to denote phosphorylation. (_d_-f) Identification of the GABAAR β subunits binding site within μ2. (d) Diagram of 35S-labeled in vitro translated μ2 deletion constructs: A, full length μ2, residues 1-435; B, residues 158-435; C, residues 158-407; D, residues 1-157, E, residues 283-394). Note the carboxyl-terminal region (residues 407-435) contains the tyrosine motif binding domain and is present in constructs A (full length μ2, residues 1-435) and B (residues 156-435), whereas the core domain of μ2 (residues 283-394) present in A-C and E has been previously shown to bind to synaptotagmin 1 AP2 binding basic domain. (e) Binding of GST β1 and β3 to all constructs containing the core domain (residues 283-394) of μ2, whereas GST-EGFR (f), which contains a tyrosine type motif, binds to full length μ2 (A) and construct C (residues 158-435) containing the carboxyl-terminal domain but not to a μ2 construct containing the core domain but lacking the carboxyl domain (residues 158-407).
Fig. 3.
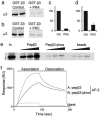
Binding of GABAAR β3 subunits to μ2 and AP2 is regulated by phosphorylation at serine residues S408 and S409. (_a_-d) GST-β3 was prephosphorylated in vitro by PKA (a and c) or PKC (b and d) and binding to 35S-labeled μ2 compared with nonphosphorylated GST-β3. (e) A peptide representing the μ2 binding domain in GABAAR β3 ICD pepβ3 (residues 401-412), binds with high affinity to 35S-labeled μ2, whereas an identical peptide, phosphorylated at serines S408 and S409 in this peptide, does not. Increasing amounts of peptide, pepβ3, and pepβ3-phos (coupled to beads via an N-terminal cysteine), or beads alone, were exposed to 35S μ2. Bound material was separated by SDS/PAGE and visualized by autoradiography. (f) Surface plasmon resonance analysis of the binding of pepβ3 and pepβ3-phos to native AP2 from brain.
Fig. 4.
Phospho- and dephospho-GABAA receptor AP2 binding peptides have different effects on mIPSCs. (a and b) Plot of normalized mIPSC amplitude (a) and frequency (b) as a function of time in cells dialyzed with the dephosphorylated peptide (pepβ3, 200 μg/ml), the phosphorylated peptide (pepβ3-phos, 200 μg/ml), or the control internal solution (without peptide). Note that the peptide pepβ3, which binds AP2 with high affinity, increases mIPSC amplitude and frequency. Each point represents the mean ± SEM of normalized mIPSCs from 4-6 cells tested. The averaged mIPSC traces from representative cells at the third min and the 30th min (time points before and after the peptide getting into the cell) are shown in a Inset (Scale bar: 10 pA, 50 ms.). (c and d) Plot of normalized mEPSC amplitude (c) and frequency (d) as a function of time in cells dialyzed with or without different peptides. (e) Representative mIPSC traces and cumulative plots of the distribution of mIPSC frequency in cells dialyzed with or without different peptides (Scale bar: 50 pA, 2 sec.).
Fig. 5.
The phospho-dependent modulation of GABAA receptor currents is occluded by inhibition of dynamin. (a and c) Plots of normalized whole-cell GABA-evoked currents as a function of time in cells dialyzed with or without different peptides. Note that the peptide pepβ3 (200 μg/ml), but not the peptide pepβ3-phos (200 μg/ml), increases the GABAAR current (a). Dialysis with the dynamin inhibitory peptide p4 (20 μM) produces a similar enhancement as dialysis with both pepβ3 and p4 peptides (c). (b and d) Cumulative data (mean ± SEM) showing the percentage control of GABAAR current amplitude with or without different peptide dialysis (by using the ratio of GABAAR current amplitude at the 15th min and the first min).
Similar articles
- Stabilization of GABA(A) receptors at endocytic zones is mediated by an AP2 binding motif within the GABA(A) receptor β3 subunit.
Smith KR, Muir J, Rao Y, Browarski M, Gruenig MC, Sheehan DF, Haucke V, Kittler JT. Smith KR, et al. J Neurosci. 2012 Feb 15;32(7):2485-98. doi: 10.1523/JNEUROSCI.1622-11.2011. J Neurosci. 2012. PMID: 22396422 Free PMC article. - Constitutive endocytosis of GABAA receptors by an association with the adaptin AP2 complex modulates inhibitory synaptic currents in hippocampal neurons.
Kittler JT, Delmas P, Jovanovic JN, Brown DA, Smart TG, Moss SJ. Kittler JT, et al. J Neurosci. 2000 Nov 1;20(21):7972-7. doi: 10.1523/JNEUROSCI.20-21-07972.2000. J Neurosci. 2000. PMID: 11050117 Free PMC article. - Regulation of synaptic inhibition by phospho-dependent binding of the AP2 complex to a YECL motif in the GABAA receptor gamma2 subunit.
Kittler JT, Chen G, Kukhtina V, Vahedi-Faridi A, Gu Z, Tretter V, Smith KR, McAinsh K, Arancibia-Carcamo IL, Saenger W, Haucke V, Yan Z, Moss SJ. Kittler JT, et al. Proc Natl Acad Sci U S A. 2008 Mar 4;105(9):3616-21. doi: 10.1073/pnas.0707920105. Epub 2008 Feb 27. Proc Natl Acad Sci U S A. 2008. PMID: 18305175 Free PMC article. - The role of GABAAR phosphorylation in the construction of inhibitory synapses and the efficacy of neuronal inhibition.
Vithlani M, Moss SJ. Vithlani M, et al. Biochem Soc Trans. 2009 Dec;37(Pt 6):1355-8. doi: 10.1042/BST0371355. Biochem Soc Trans. 2009. PMID: 19909275 Free PMC article. Review.
Cited by
- Delivery of GABAARs to synapses is mediated by HAP1-KIF5 and disrupted by mutant huntingtin.
Twelvetrees AE, Yuen EY, Arancibia-Carcamo IL, MacAskill AF, Rostaing P, Lumb MJ, Humbert S, Triller A, Saudou F, Yan Z, Kittler JT. Twelvetrees AE, et al. Neuron. 2010 Jan 14;65(1):53-65. doi: 10.1016/j.neuron.2009.12.007. Neuron. 2010. PMID: 20152113 Free PMC article. - In the fast lane: Receptor trafficking during status epilepticus.
Naylor DE. Naylor DE. Epilepsia Open. 2023 May;8 Suppl 1(Suppl 1):S35-S65. doi: 10.1002/epi4.12718. Epub 2023 Mar 20. Epilepsia Open. 2023. PMID: 36861477 Free PMC article. Review. - Salicylate-Induced Ototoxicity of Spiral Ganglion Neurons: Ca2+/CaMKII-Mediated Interaction Between NMDA Receptor and GABAA Receptor.
Qin D, Liu P, Chen H, Huang X, Ye W, Lin X, Wei F, Su J. Qin D, et al. Neurotox Res. 2019 May;35(4):838-847. doi: 10.1007/s12640-019-0006-8. Epub 2019 Feb 28. Neurotox Res. 2019. PMID: 30820888 - Phosphorylation events and the modulation of aquaporin 2 cell surface expression.
Brown D, Hasler U, Nunes P, Bouley R, Lu HA. Brown D, et al. Curr Opin Nephrol Hypertens. 2008 Sep;17(5):491-8. doi: 10.1097/MNH.0b013e3283094eb1. Curr Opin Nephrol Hypertens. 2008. PMID: 18695390 Free PMC article. Review. - Positive feedback regulation between gamma-aminobutyric acid type A (GABA(A)) receptor signaling and brain-derived neurotrophic factor (BDNF) release in developing neurons.
Porcher C, Hatchett C, Longbottom RE, McAinch K, Sihra TS, Moss SJ, Thomson AM, Jovanovic JN. Porcher C, et al. J Biol Chem. 2011 Jun 17;286(24):21667-77. doi: 10.1074/jbc.M110.201582. Epub 2011 Apr 7. J Biol Chem. 2011. PMID: 21474450 Free PMC article.
References
- Moss, S. J. & Smart, T. G. (2001) Nat. Rev. Neurosci. 2, 240-250. - PubMed
- Sieghart, W. & Sperk, G. (2002) Curr. Top. Med. Chem. 2, 795-816. - PubMed
- Kittler, J. T. & Moss S. J. (2001) Traffic 2, 437-448. - PubMed
- Nusser, Z., Cull-Candy, S. & Farrant, M. (1997) Neuron 19, 697-709. - PubMed
- Nusser, Z., Hajos, N., Somogyi, P. & Mody, I. (1998) Nature 395, 172-177. - PubMed
Publication types
MeSH terms
Substances
Grants and funding
- R21 NS103865/NS/NINDS NIH HHS/United States
- NS047478/NS/NINDS NIH HHS/United States
- NS048045/NS/NINDS NIH HHS/United States
- R01 NS051195/NS/NINDS NIH HHS/United States
- R01 NS056359/NS/NINDS NIH HHS/United States
- R01 NS047478/NS/NINDS NIH HHS/United States
- R01 NS048045/NS/NINDS NIH HHS/United States
- WT_/Wellcome Trust/United Kingdom
- R01 MH118263/MH/NIMH NIH HHS/United States
LinkOut - more resources
Full Text Sources
Molecular Biology Databases
Research Materials


