Expression of human peripheral cannabinoid receptor for structural studies - PubMed (original) (raw)
Expression of human peripheral cannabinoid receptor for structural studies
Alexei A Yeliseev et al. Protein Sci. 2005 Oct.
Abstract
Human peripheral-type cannabinoid receptor (CB2) was expressed in Escherichia coli as a fusion with the maltose-binding protein, thioredoxin, and a deca-histidine tag. Functional activity and structural integrity of the receptor in bacterial protoplast membranes was confirmed by extensive binding studies with a variety of natural and synthetic cannabinoid ligands. E. coli membranes expressing CB2 also activated cognate G-proteins in an in vitro coupled assay. Detergent-solubilized receptor was purified to 80%-90% homogeneity by affinity chromatography followed by ion-exchange chromatography. By high-resolution NMR on the receptor in DPC micelles, it was determined that purified CB2 forms 1:1 complexes with the ligands CP-55,940 and anandamide. The receptor was successfully reconstituted into phosphatidylcholine bilayers and the membranes were deposited into a porous substrate as tubular lipid bilayers for structural studies by NMR and scattering techniques.
Figures
Figure 1.
Schematic representation of the CB2 receptor fusion proteins.
Figure 2.
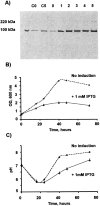
Time course of CB2-107 expression in E. coli. (A) An overnight culture of BL21-107 cells was used to inoculate several incubation flasks containing equal volumes of media. Induction was started when cell density reached OD600 = 0.4. Cell samples were collected at various time points before and after the induction with IPTG. Samples containing an equal number of cells were lyzed in Laemmly sample buffer and proteins separated on a 10% SDS-PAGE. After electroblotting onto the nitrocellulose membranes, proteins were probed with anti-His INDIA-HRP reagent. C0 and C5, control cells without addition of IPTG at time points 0 and 72 h. (Lanes 1_–_5) Induced cells at time points: 0, 16, 24, 40, 48, and 72 h, respectively. (B) Time course of BL21-107 cell growth as measured by changes in OD600. (Dotted line) Cells without induction; (solid line) cells induced with 1 mM IPTG. (C) pH of the incubation media during the incubation of BL21-107.
Figure 3.
Saturation binding of [3H] CP-55,940 on BL21-107 membranes expressing CB2. The assay was performed in triplicate as described in Materials and Methods.
Figure 4.
Competitive binding of cannabinoid ligands on BL21-107 membranes expressing CB2. The assay was performed in triplicate as described in Materials and Methods.
Figure 5.
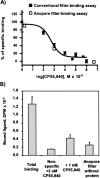
Ligand-binding assay on Anopore filters. (A) Comparison of the conventional filter-binding assay performed on Whatman GF/B filters (▪) and ligand binding performed on Anopore membranes (□). (B) Competition binding of [3H] CP-55,940 on Anopore filters loaded with BL21-107 membranes expressing CB2.
Figure 6.
Activation of G-proteins by the E. coli membranes expressing CB2. The assay was performed as described in Materials and Methods using either 2.7 or 5.4 μg of urea-treated membranes per sample. Background (binding of [35S]-GTPγS to Gαi in the absence of CB2) was subtracted. All measurements were performed in triplicate.
Figure 7.
Purification of fusion CB2 on Ni-NTA agarose: SDS-PAGE and Western blot analysis. (A) SDS-PAGE of fractions from Ni-NTA agarose: (lane C) crude extract applied onto Ni-NTA column; (lane F) flowthrough fractions; (lane W) wash fractions; (lane E) elution with 200 mM imidazole. (B) Western-blot analysis of fractions from the Ni-NTA column. The membrane were probed with anti-MBP antibody. Lanes C, F, W, and E are the same as in A. (C,D) Western-blot analysis of protein eluted from Ni-NTA column probed with anti-CB2 antibodies (C) or INDIA-HRP anti-His reagent (D).
Figure 8.
Cleavage of the CB2 fusion protein with Tev protease. The Western blot was probed with antibodies against CB2.
Figure 9.
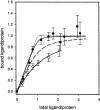
Ligand binding to purified, recombinant CB2 in the micellar state. On the _X_-axis the concentration of ligand divided by the concentration of ligand-binding-competent CB2 is reported. On the _Y_-axis the concentration of ligand bound to CB2 is shown (•, CP-55,940; ○, anandamide). The solid lines are a fit to the data points assuming formation of a 1:1 complex between CB2 and ligands (CP-55,940, _K_d = 5 × 10⁻⁷ M; for comparison, the curve for _K_d = 5 × 10⁻⁶ M [dashed line] and _K_d = 5 × 10⁻¹⁰ M [dotted line] are shown as well; anandamide, _K_d = 1 × 10⁻⁵).
Figure 10.
Reconstitution of fusion CB2 receptor into SOPC liposomes: confocal microscopy. Proteoliposomes were generated from Alexa Fluor 532-labeled CB2 and from Texas Red-labeled lipid. (A) Green fluorescence derived from Alexa Fluor 532; (B) red emission derived from Texas Red; (C) superimposed emission from Alexa Fluor 532 and Texas Red. Pseudocolors are used; green represents fluorescent emission of Alexa Fluor 532 and red emission of Texas Red.
Figure 11.
Reconstitution of CB2 into lipid bilayer and deposition into Anopore membranes. (A) Membrane scanned at 532 nm (λexc) and 580 nm (λem), optimal for Alexa Fluor 532. (B) Membranes scanned at 583 nm (λexc) and 610 nm (λem), favoring detection of Texas Red. (1) Labeled CB2 + unlabeled lipids; (2) labeled CB2 + labeled lipids; (3) labeled CB2 (without lipid); (4) labeled lipids; (5) Alexa Fluor 532 dye. Pseudocolors are used; green represents fluorescent emission of Alexa Fluor 532 and red emission of Texas Red.
Figure 12.
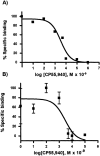
Competitive binding of CP-55,940 on purified recombinant CB2 reconstituted into a lipid matrix. (A) Conventional filter-binding assay. (B) Ligand-binding assay performed on lipid-reconstituted CB2 deposited onto Anopore membranes.
Similar articles
- Bacterial expression of functional, biotinylated peripheral cannabinoid receptor CB2.
Krepkiy D, Wong K, Gawrisch K, Yeliseev A. Krepkiy D, et al. Protein Expr Purif. 2006 Sep;49(1):60-70. doi: 10.1016/j.pep.2006.03.002. Epub 2006 Mar 27. Protein Expr Purif. 2006. PMID: 16621595 - Use of dual affinity tags for expression and purification of functional peripheral cannabinoid receptor.
Yeliseev A, Zoubak L, Gawrisch K. Yeliseev A, et al. Protein Expr Purif. 2007 May;53(1):153-63. doi: 10.1016/j.pep.2006.12.003. Epub 2006 Dec 12. Protein Expr Purif. 2007. PMID: 17223358 Free PMC article. - Application of Strep-Tactin XT for affinity purification of Twin-Strep-tagged CB2, a G protein-coupled cannabinoid receptor.
Yeliseev A, Zoubak L, Schmidt TGM. Yeliseev A, et al. Protein Expr Purif. 2017 Mar;131:109-118. doi: 10.1016/j.pep.2016.11.006. Epub 2016 Nov 17. Protein Expr Purif. 2017. PMID: 27867058 Free PMC article. - Methods for recombinant expression and functional characterization of human cannabinoid receptor CB2.
Yeliseev AA. Yeliseev AA. Comput Struct Biotechnol J. 2013 Sep 6;6:e201303011. doi: 10.5936/csbj.201303011. eCollection 2013. Comput Struct Biotechnol J. 2013. PMID: 24688719 Free PMC article. Review. - Enhancing the solubility of recombinant proteins in Escherichia coli by using hexahistidine-tagged maltose-binding protein as a fusion partner.
Sun P, Tropea JE, Waugh DS. Sun P, et al. Methods Mol Biol. 2011;705:259-74. doi: 10.1007/978-1-61737-967-3_16. Methods Mol Biol. 2011. PMID: 21125392 Review.
Cited by
- Tagging Recombinant Proteins to Enhance Solubility and Aid Purification.
Loughran ST, Walls D. Loughran ST, et al. Methods Mol Biol. 2023;2699:97-123. doi: 10.1007/978-1-0716-3362-5_7. Methods Mol Biol. 2023. PMID: 37646996 - Use of tandem affinity chromatography for purification of cannabinoid receptor CB₂.
Locatelli-Hoops SC, Yeliseev AA. Locatelli-Hoops SC, et al. Methods Mol Biol. 2014;1177:107-20. doi: 10.1007/978-1-4939-1034-2_9. Methods Mol Biol. 2014. PMID: 24943318 Free PMC article. - Expression, surface immobilization, and characterization of functional recombinant cannabinoid receptor CB2.
Locatelli-Hoops SC, Gorshkova I, Gawrisch K, Yeliseev AA. Locatelli-Hoops SC, et al. Biochim Biophys Acta. 2013 Oct;1834(10):2045-56. doi: 10.1016/j.bbapap.2013.06.003. Epub 2013 Jun 15. Biochim Biophys Acta. 2013. PMID: 23777860 Free PMC article. - Expression and NMR Structural Studies of Isotopically Labeled Cannabinoid Receptor Type II.
Yeliseev A, Gawrisch K. Yeliseev A, et al. Methods Enzymol. 2017;593:387-403. doi: 10.1016/bs.mie.2017.06.020. Epub 2017 Jul 11. Methods Enzymol. 2017. PMID: 28750812 Free PMC article. - Global fold of human cannabinoid type 2 receptor probed by solid-state 13C-, 15N-MAS NMR and molecular dynamics simulations.
Kimura T, Vukoti K, Lynch DL, Hurst DP, Grossfield A, Pitman MC, Reggio PH, Yeliseev AA, Gawrisch K. Kimura T, et al. Proteins. 2014 Mar;82(3):452-65. doi: 10.1002/prot.24411. Epub 2013 Oct 17. Proteins. 2014. PMID: 23999926 Free PMC article.
References
- Broos, J., ter Veld, F., and Robillard, G.T. 1999. Membrane protein–ligand interactions in Escherichia coli vesicles and living cells monitored via a biosynthetically incorporated tryptophan analogue. Biochemistry 38 9798–9803. - PubMed
- Calandra, B., Tucker, J., Shire, D., and Grisshammer, R. 1997. Expression in Escherichia coli and characterisation of the human central CB1 and peripheral CB2 cannabinoid receptors. Biotechnol. Lett. 19 425–428.
- Chin, C.N., Murphy, J.W., Huffman, J.W., and Kendall, D.A. 1999. The third transmembrane helix of the cannabinoid receptor plays a role in the selectivity of aminoalkylindoles for CB2, peripheral cannabinoid receptor. J. Pharmacol. Exp. Therap. 291 837–844. - PubMed
- Felder, C.C., Veluz, J.S., Williams, H.L., Briley, E.M., and Matsuda, L.A. 1992. Cannabinoid agonists stimulate both receptor-mediated and non-receptor-mediated signal transduction pathways in cells transfected with and expressing cannabinoid receptor clones. Mol. Pharmacol. 42 838–845. - PubMed
Publication types
MeSH terms
Substances
LinkOut - more resources
Full Text Sources
Other Literature Sources
Miscellaneous


